
目录
I. Not All Customer Demand Can Be Included in Revenue Forecasts
II. Scarce Manufacturing Resources Are Changing Suppliers’ Order Priorities
III. How Much of the Price Increase Sticks Depends on What Long-Term Agreements Lock In
IV. Why the Same Price Increase Can Produce Very Different Profits
V. Five Companies, Five Different Conditions for Delivery
Samsung: HBM Catch-Up Must Be Assessed Within the Broader Product Portfolio
SK Hynix: HBM May Grow Faster, but DDR Could Contribute More Incremental Revenue
Micron: Revenue and Earnings Are Strong, but Cash Deployment Still Matters
Sandisk: Contracts Improve Visibility, but the Cost Assumptions Behind High Margins Still Require Validation
Kioxia: Beyond Products and Contracts, Collections and Capital Structure Are Also Reshaping Returns
VI. Early Warning Signs That the Bull Case Needs to Be Revised Down
本内容基于公开资料和研报数据整理,不构成任何投资建议,不代表任何个人观点,仅供学习参考,请理性阅读
AI customers want ever more memory, but suppliers’ profits will not rise proportionally with the shortfall. The key differentiators among HBM, DDR5, and NAND vendors are how much they can deliver, how much revenue can be repriced, which products receive priority for scarce capacity, and whether cash is retained for expansion or returned to shareholders.
I. Not All Customer Demand Can Be Included in Revenue Forecasts
The first distinction in this memory and storage investment cycle is between how much customers want and how much suppliers can ultimately deliver. When demand is rising rapidly and lead times are lengthening, the gap can be substantial. It indicates stress in the industry, but does not automatically translate into supplier orders, revenue, or profit.
UBS highlighted this distinction in its September storage monthly report, published on August 30. The report said cloud customers continued to raise their demand requests for DDR5, LPDDR5X, and enterprise SSDs, in some cases above the volumes specified in long-term agreements. Unconstrained demand for servers and storage SSDs could grow by more than 100% in 2027, while actual deliverable volume growth may be closer to 40%.
Both figures are UBS industry estimates and should not be interpreted as confirmed orders already doubling. Customers may overstate demand to secure supply or solicit quotes from multiple vendors simultaneously. Some projects may also change timing or specifications as prices move. Supplier revenue analysis must still be anchored in volumes that can be delivered and that customers are willing to take.
That does not make the gap immaterial. If customers are genuinely willing to pay, shortages increase the value of scarce supply. Vendors may raise prices on floating-volume orders, prioritize higher-margin products, or demand longer purchase commitments. Customers may not receive everything they request, yet suppliers can still earn more on the volumes they do deliver.
Incremental demand must therefore pass through several filters. After a customer submits a request, its budget and project schedule must be confirmed. Once the supplier accepts an order, manufacturing, qualification, and delivery still need to be arranged. Only after the equipment reaches the customer does it gradually translate into actual usage. Combining all these stages into a single “demand” category can pull revenue forward before it has materialized.
UBS’s DRAM forecast also shows why no single growth metric is sufficient. It projects terminal bit consumption to rise 39.8% in 2027 and bit supply to increase 23.3%. After adjusting for changes in customer inventories, however, growth in procurement demand from suppliers falls to 20.6%. These three figures answer different questions: how much users consume, how much suppliers produce and deliver, and how much customers need to purchase.
These growth rates cannot simply be subtracted to derive a purported shortage percentage. Their bases, inventory ownership, and timing differ. In UBS’s table, the adjusted supply-demand sufficiency ratio improves from -7.6% in 2026 to -5.6% in 2027. Supply remains insufficient, but faster terminal-demand growth does not necessarily mean the shortage must widen every year.
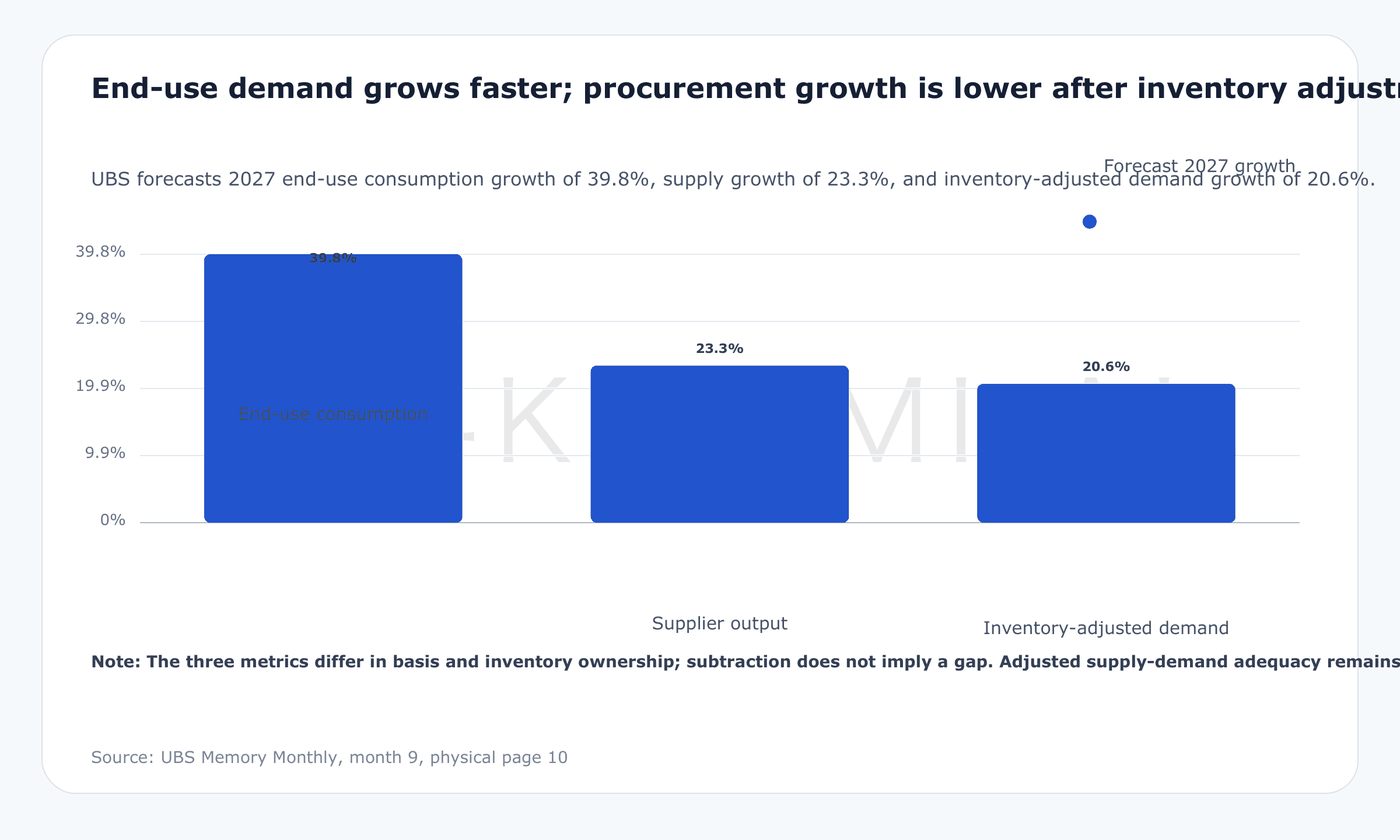
Inventory provides the buffer. Customers that take more product in 2026 can draw down those stocks in 2027 and reduce new purchases. Continued growth in end demand can therefore coexist with slower procurement growth. For manufacturers, strong early orders do not guarantee equal acceleration the following year; for investors, inventory digestion does not necessarily mean underlying demand has collapsed.
The real questions are how long inventory can provide a buffer and whether customers hold the right products. Inventory of an older specification cannot always substitute for the high-end products required by a new platform. HBM is also constrained by customer and product qualification, while enterprise SSDs have controller, firmware, and reliability requirements. Aggregate inventories may appear ample even when particular products remain unavailable.
This can produce company-level divergence before it becomes visible in industry totals. Vendors with the right products and completed customer qualifications have a better chance of converting incremental requests into actual sales. Those with mismatched capacity or lengthy conversion timelines may generate little additional revenue despite facing the same buoyant market. Strong demand alone does not explain which company will earn more.
Traditional end markets will absorb part of the adjustment. In the same report, UBS argued that supply and cost conditions could continue to deteriorate for PC and smartphone manufacturers, creating downside risk to its previous forecast of 2% shipment growth for both categories in 2027. AI customers may have larger budgets and higher-value products, but that does not mean consumer-electronics customers can absorb price increases of the same magnitude.
If device manufacturers cut lower-end models, reduce promotions, or delay new launches, memory demand will respond. Upstream shortages raise prices, while downstream cost pressure reduces volumes; ultimate revenue depends on the interaction between the two. Combining incremental AI-related bits with the potential decline in bits purchased for smartphones and PCs provides a better estimate of transaction volumes across the industry.
This is the report’s core assessment of demand: customer requests indicate the direction of growth, deliverable volumes determine how much revenue can be realized, and products and contracts determine pricing. All three matter. Selecting only the most optimistic variable will overstate the profits ultimately retained from the shortage.
II. Scarce Manufacturing Resources Are Changing Suppliers’ Order Priorities
Suppliers cannot fulfill all demand for reasons extending beyond limited fabrication space. Existing manufacturing resources must be allocated among products, new equipment must be delivered and commissioned, new products require customer qualification, and yields must ultimately reach acceptable levels. There is a meaningful lag between the increase in capital expenditure visible to investors and the resulting increase in saleable bits.
HBM makes the term “capacity” particularly easy to misinterpret. After functional dies are produced on the wafer, they must still be stacked, packaged, and tested before becoming usable products. Adding one wafer start does not immediately produce a proportional increase in HBM deliveries. Similarly, increasing the stack height cannot be assessed solely through selling price and capacity without considering manufacturing complexity and yield.
HBM and server DDR also compete for some upstream resources. UBS’s August 30 report on SK hynix provided a specific example: it raised its forecast for SK hynix’s 2027 DRAM bit shipments while lowering its HBM shipment forecast, partly because the company needed to allocate more resources to server DDR5 and LPDDR5X. Total DRAM bit growth can therefore coexist with reallocation between HBM and conventional DDR.
The report assumes an approximately 3.2-to-1 conversion ratio between HBM4 and DDR wafer resources, driven mainly by differences in die area. This is a specific modeling assumption, not a universal constant across all processes and products. It indicates that shifting the same manufacturing resources toward conventional DDR can yield more bits, but bit volume alone cannot establish that the shift will be more profitable.
The decision ultimately depends on customer pricing and resource-level costs. If conventional DDR prices rise rapidly while some HBM pricing is already locked in, increasing DDR supply may become more attractive. Conversely, if a new HBM generation commands higher prices and yields improve, maintaining an HBM bias may generate better returns. Suppliers are effectively comparing how much profit each allocation of scarce resources can contribute.
HBM market share must therefore sometimes be assessed alongside opportunities in conventional DRAM. Slower HBM shipment growth at SK hynix may partly reflect an active product-mix decision, while Samsung’s expansion of HBM supply may consume resources previously allocated to other DRAM products. Only by evaluating volumes, pricing, costs, and resource allocation together can investors distinguish competitive setbacks from more favorable operating choices.
Product specifications themselves may also adapt to supply conditions. UBS’s August monthly report discussed the possibility that future accelerator platforms could adopt lower stack heights, reflecting efforts by suppliers and customers to find more feasible solutions under tight supply. The forecast nature of this assessment must be preserved: final platform configurations will depend on formally launched products and actual deliveries.
Lower HBM content per chip does not necessarily mean the industry will sell less HBM overall. Platform volumes, the number of accelerators per system, and demand from other customers may all change. Easier-to-manufacture specifications could also improve deliveries. Conversely, the implications would differ if the change reflected end customers reducing performance targets or budgets. No conclusion should be drawn from “specification cuts” alone.
NAND faces different resource constraints from HBM. NAND bit supply depends not only on wafer volumes but also on process technology, die capacity, product mix, and yields. Higher density can increase output per wafer, but migration requires investment and time. Even if raw NAND capacity increases, investors must still determine whether enterprise-SSD controllers, firmware, qualification, and delivery capabilities can keep pace.
This creates a distinction between low-cost commodity supply and supply deliverable to specific data-center customers. Goldman Sachs’s August 25 commentary on Kioxia’s earnings call noted that enterprise SSDs require customer-specific software customization, with development and implementation taking time. These barriers can delay entry by new competitors, but they also prevent manufacturers from immediately selling every incremental bit into the highest-value market.
At the same time, customer qualification advantages do not constitute permanent barriers. Large customers can develop second-source suppliers, new products may alter existing market shares, and suppliers’ own R&D; and validation costs may rise. Investment analysis should focus on which products can be delivered to which customers and when—not assign persistently high margins simply because technical barriers exist.
Capacity expansion also affects cash flow. Customers may be pressing for supply today, but vendors may first need to pay for equipment and fabrication facilities. Depreciation enters costs later, while yield improvements may take even longer. If prices retreat before new capacity becomes fully productive, revenue growth and capital deployment will be mistimed. Years of acute supply tightness may therefore also be when risks to the next cycle’s returns on capital begin to accumulate.
Caution, however, should not be equated with refusing to expand. Underinvestment could cost suppliers key customers and technology transitions. Once competitors qualify first, latecomers may struggle to recover market share quickly. The relevant comparison is whether each company’s incremental investment primarily expands physical capacity, improves efficiency, or upgrades products—and when those investments generate revenue and cash under the original forecast model.
