
目录
I. All Three Are Bullish—So Why Are Their Price Targets So Far Apart?
II. The Common Starting Point: Optical Modules Are Taking On a Larger System Role
III. Aligning Revenue Forecasts: The Main Divergence Emerges After 2027
IV. Why Citi Forecasts Higher Profit on Nearly Identical Revenue
V. Goldman Sachs’s RMB2,645 Target Primarily Reflects a Higher Valuation on Growth
VI. Why Citi Forecasts High Growth While Constraining the Multiple
VII. Morgan Stanley’s Real Question: How Long Can Excess Returns Last?
VIII. CPO Is Not Simply Bullish or Bearish—the Key Is Who Captures the Profit
IX. Whether Growth Converts into Cash Is Another Key Test Across the Three Reports
10. A-Shares and H-Shares Must Be Assessed Separately, and Risks Cannot Simply Be Averaged
11. How Subsequent Evidence Can Validate the Three Models
本内容基于公开资料和研报数据整理,不构成任何投资建议,不代表任何个人观点,仅供学习参考,请理性阅读
Citi, Morgan Stanley, and Goldman Sachs are all bullish on Zhongji Innolight, but their earnings trajectories and price targets differ sharply. The divergence extends beyond orders: as technology shifts, who captures the profits—and how many years of growth should investors pay for today?
I. All Three Are Bullish—So Why Are Their Price Targets So Far Apart?
The most revealing takeaway from these three reports is that the institution with the highest earnings forecasts does not assign the highest price target. Citi forecasts Zhongji Innolight’s net profit at RMB97.235bn in 2027 and RMB166.898bn in 2028, both above Goldman Sachs’s estimates. Yet Citi’s A-share price target is RMB1,325, versus RMB2,645 at Goldman Sachs. Ranking the banks solely by price target would therefore miss the most important disagreement among their reports.
Morgan Stanley occupies a different position. It assigns an A-share price target of RMB1,205 and forecasts net profit of RMB70.056bn in 2027 and RMB92.189bn in 2028. This earnings trajectory is lower than those of the other two banks, while its valuation incorporates the timing of CPO breakthroughs, long-term earnings power, and alternative technology scenarios.
The comparison should therefore be made on three levels: how much product the company can deliver and how much revenue that generates; how much of that revenue ultimately becomes attributable profit and cash flow; and how long those profits can persist and what multiple the market should assign them. All three banks expect AI-driven bandwidth demand to expand, but they differ on product mix, expenses, and supply assumptions—and diverge even more sharply in their valuation methodologies.
The ratings point in the same direction, but earnings and valuation assumptions differ
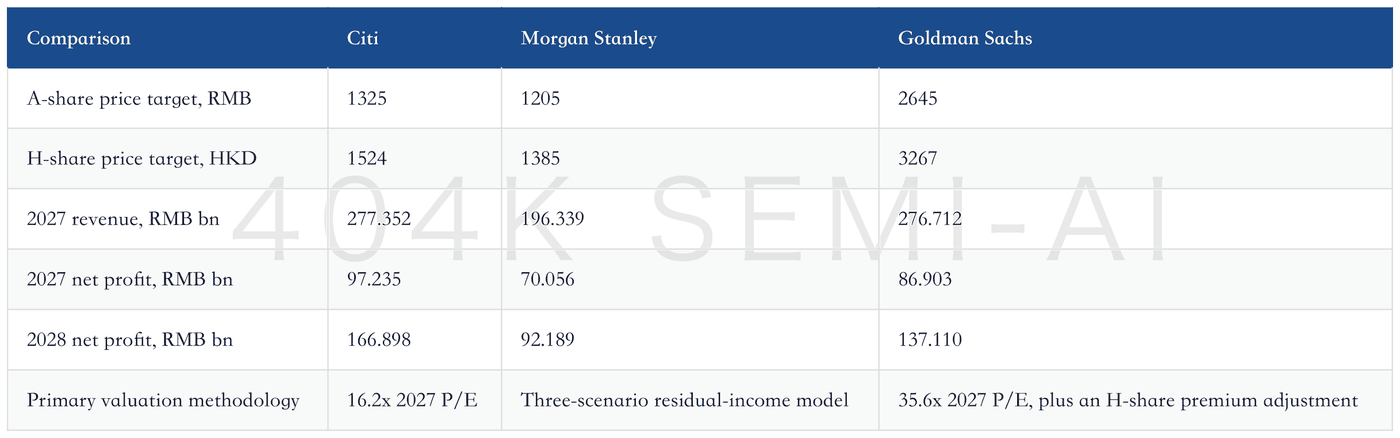
All figures above are forecasts or price targets from the three reports dated September 7, 2026. Financial figures have been converted into RMB billions. They are neither realized operating results nor price targets independently issued by this report. A-share and H-share valuations are compared separately to avoid conflating operating assumptions with exchange-rate effects and market premiums.
The three reports also do not represent three entirely independent demand surveys. They cover the same company and draw on broadly similar customer capex plans, product roadmaps, and publicly available operating information. Their consistent ratings strengthen the case that Zhongji Innolight warrants close attention, but repeating common-source information three times does not make it three times as persuasive. What matters is where their models diverge—and which subsequent facts validate or eliminate each path.
II. The Common Starting Point: Optical Modules Are Taking On a Larger System Role
All three banks begin from the same premise: AI clusters are raising the performance requirements for communications infrastructure. Optical modules convert electrical and optical signals, enabling data transmission between devices. AI training and inference require large numbers of processors to work together; as the number of computing units increases, data exchange must keep pace. Otherwise, expensive computing hardware may remain underutilized while waiting for communications.
This creates two dimensions of optical-interconnect demand. First, the number of connections rises as more servers, switches, and racks need to communicate. Second, per-connection speeds increase from 400G and 800G to 1.6T and beyond. The former drives unit volumes; the latter changes product mix and value per unit. When assessing revenue, these effects must be separated rather than attributing all growth to higher module prices.
The shared bet across all three banks is that high-specification products will shift from a supplementary business to the principal revenue contributor. Citi forecasts Zhongji Innolight’s optical-module shipments at 30.10 million units in 2026, 60.20 million in 2027, and 96.40 million in 2028. Of these, 800G-and-above products are expected to account for 26.00 million, 57.00 million, and 94.00 million units, respectively—approximately 86%, 95%, and 98% of total shipments. Its model therefore assumes an exceptionally advanced transition from lower-speed to higher-speed products. (Citi, pp. 1 and 11–12)
Morgan Stanley’s financial summary reflects a similar trajectory. It forecasts 1.6T revenue rising from RMB57.624bn in 2026 to RMB128.105bn in 2027, increasing from 53% to 65% of total revenue. By 2028, 1.6T revenue is projected at approximately RMB125.581bn, with its share falling to 50%. This illustrates how one product generation can grow rapidly before reaching relative maturity; a company’s overall growth does not require any single speed category to sustain high growth indefinitely. (Morgan Stanley, p. 2)
Goldman Sachs further divides the opportunity into Scale-out, Scale-up, and Scale-across. Broadly, Scale-out expands connectivity between clusters, Scale-up enables tighter interconnection among computing resources, and Scale-across connects clusters over longer distances. These applications have different requirements for distance, power consumption, latency, and maintenance. They broaden the use cases for optical interconnects, but do not imply that the same module can be deployed unchanged across every position.
From an operating perspective, each technology upgrade requires not only faster components but also better design, packaging, testing, and high-volume delivery. Customers are buying connectivity that can be deployed reliably. There is a substantial gap between producing a laboratory sample and consistently delivering several million specification-compliant units—a gap defined by yield, thermal management, consistency, and supply-chain execution.
This is also why market leaders may enjoy an advantage. When customers are racing to deploy next-generation AI systems, supplier selection depends on more than price: qualification history, manufacturing scale, access to critical components, and delivery reliability all matter. However, these advantages must be re-established with each product generation. Technology transitions can reinforce incumbent leadership, but they can also create switching windows for new entrants; market share in one generation is no guarantee of leadership in the next.
III. Aligning Revenue Forecasts: The Main Divergence Emerges After 2027
Comparing the three revenue forecasts makes the differences in growth trajectories immediately apparent. Citi forecasts RMB104.216bn, RMB277.352bn, and RMB456.338bn for 2026–2028, respectively; Morgan Stanley projects RMB107.904bn, RMB196.339bn, and RMB251.279bn; and Goldman Sachs estimates RMB131.870bn, RMB276.712bn, and RMB417.779bn. Goldman Sachs has the highest 2026 forecast, while Citi and Goldman Sachs are nearly aligned in 2027, after which Citi moves further ahead in 2028. (Citi, p. 12; Morgan Stanley, p. 2; Goldman Sachs, p. 2)
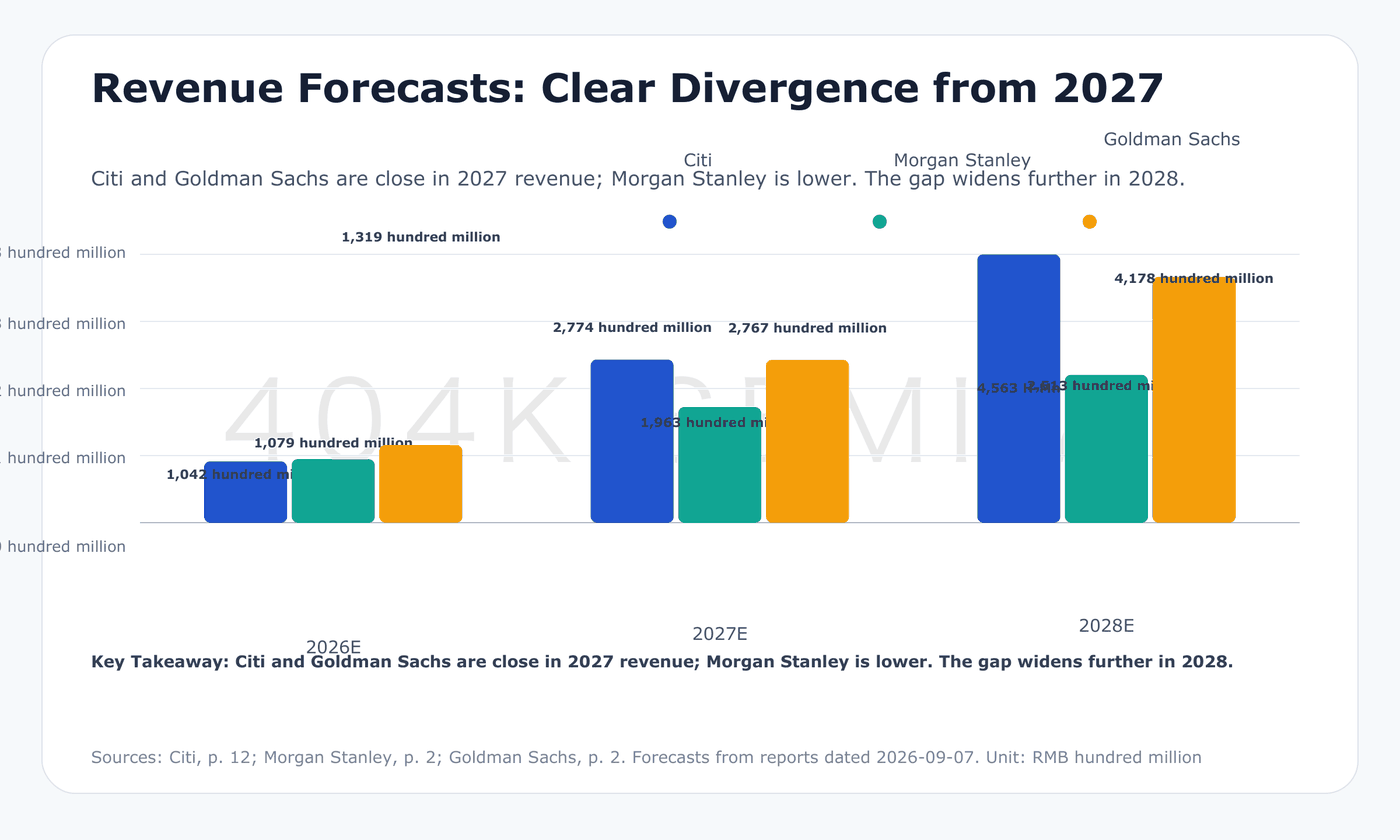
2027 is the most important inflection point to monitor. Citi’s and Goldman Sachs’s revenue forecasts differ by only approximately RMB640mn, or around 0.23%, while Morgan Stanley’s forecast is approximately RMB81.0bn below both. That gap is too large to explain through modest pricing or exchange-rate adjustments. It reflects a combination of assumptions about product ramp-up, the inclusion of new businesses in the model, and the durability of industry growth.
The divergence widens further in 2028. Citi’s revenue forecast is approximately 81.6% above Morgan Stanley’s, while Goldman Sachs’s is approximately 66.3% higher. Thus, although all three ratings point in the same direction, their operating scenarios are far from aligned. Simply averaging them into an “institutional consensus” would create a midpoint that none of the banks has actually substantiated, obscuring the assumptions that need to be tested.
Citi’s trajectory reflects revenue growth driven jointly by high-speed product volumes and mix. High-specification products approach the entirety of shipments, accompanied by new opportunities in 2.4T, 3.2T, XPO, and NPO. Two assumptions must be validated separately: whether total module volumes can increase as projected, and whether the high-specification mix can generate the revenue required by the model. Volumes may meet expectations while revenue still disappoints if the product mix skews lower.
Goldman Sachs’s higher 2026 forecast indicates a more aggressive view of the near-term ramp. It also explicitly forecasts Scale-up revenue of RMB28.18bn in 2027 and RMB70.753bn in 2028, representing approximately 10% and 17% of total revenue. This is a new revenue stream already embedded in its financial model, not merely a technology prospect discussed in the narrative. The more material its contribution becomes, the more important it is to validate customer adoption and the timing of volume production. (Goldman Sachs, p. 6)
Morgan Stanley expects total revenue growth to slow to 28% in 2028, versus approximately 65% at Citi and 51% at Goldman Sachs. This deceleration does not mean Morgan Stanley is bearish on optical communications; it means its assumptions for medium-term expansion are more restrained. Its discussion of technology substitution and competition also makes it easier to see how growth could normalize at some point.
Industry market-size estimates likewise cannot be ranked without adjusting for scope. Citi discusses the global optical-interconnect market, Goldman Sachs separates the optical-module market from emerging applications, and Morgan Stanley focuses on high-speed AI optical modules across different networking scenarios. These estimates may cover different speeds, customers, and products, while revenue figures are also denominated in both US dollars and renminbi. This report therefore uses company revenue, profit, and directly comparable business forecasts as its primary axes of comparison, while preserving the distinct boundaries of each institution’s industry estimates.
More fundamentally, company revenue depends on more than the size of the industry. It also reflects the range of products the company can address, customer share, supply capacity, realized selling prices, and revenue-recognition timing. Strong industry demand combined with constrained company supply may create an order backlog; an expanding industry combined with declining market share may leave company revenue growth trailing peers. Applying a constant long-term market share directly to total industry demand often understates the complexity of manufacturing and competition.
