
Contents
Table of Contents
Growth Is Driven by Higher Material Content per System
Why Copper Clad Laminates Are Bottlenecking High-Speed Compute
Shifting Focus from Chip Counts to Rack-Level Material Dollar Content
Longer Lead Times: Capacity Expansion Goes Beyond Tool Counts
The Copper Foil Opportunity: Processing Capabilities and Effective Supply
How High-End Glass Fabric Upgrades Spill Over into Commodity Materials
Five Companies, Five Distinct Profit Drivers
Key Long-Term Assumptions Underpinning High Price Targets
Stress-Testing the Growth Model
Catalysts That Could Shift the Current Material Cycle
This content is compiled from publicly available information and research reports. It does not constitute investment advice or represent any individual's views. For educational reference only; please read critically.
AI servers are reshaping value distribution across foundational electronic materials. The true bottleneck is not theoretical capacity, but qualified supply capable of balancing high-speed transmission, high layer counts, and stable mass production. While addressable market expansion is substantial, the ultimate profit captured by suppliers depends on customer qualifications, production yields, expansion cadence, and evolving technology roadmaps.
Table of Contents
Growth Is Driven by Higher Material Content per System
Why Copper Clad Laminates Are Bottlenecking High-Speed Compute
Shifting Focus from Chip Counts to Rack-Level Material Dollar Content
Longer Lead Times: Capacity Expansion Goes Beyond Tool Counts
The Copper Foil Opportunity: Processing Capabilities and Effective Supply
How High-End Glass Fabric Upgrades Spill Over into Commodity Materials
Five Companies, Five Distinct Profit Drivers
Key Long-Term Assumptions Underpinning High Price Targets
Stress-Testing the Growth Model
Catalysts That Could Shift the Current Material Cycle
Growth Is Driven by Higher Material Content per System
Capital spending on AI infrastructure is broadening well beyond silicon. As inter-chip data traffic intensifies, the printed circuit boards (PCBs) carrying these electrical signals require comprehensive upgrades. Upstream materials—copper clad laminates (CCL), copper foil, and glass fabric—are capturing a larger share of system value, directly dictating both system performance and manufacturing yields.
In its September 2026 forecast, Morgan Stanley projected the global CCL market to expand from ~$19.0B in 2025 to ~$47.0B by 2030, representing a five-year CAGR approaching 20%. Demand from AI and data centers accounts for roughly 90% of this incremental growth. This forecast hinges on concurrent platform transitions, shipment volume growth, and material price hikes; the eventual market size depends on all three assumptions materializing simultaneously.
Crucially, the composition of growth matters more than the headline terminal TAM. Morgan Stanley's detailed breakdown starts from an $18.8B base in 2025 and layers in ~$4.1B in volume growth from AI and data centers, $21.3B in per-system dollar-content gains, and $3.4B in other increments, arriving at a terminal market size of ~$47.5B. While minor rounding differences exist across sub-items, the primary driver is clear.
Of the $25.4B incremental growth generated by AI and data centers, approximately 84% stems from content gains (ASP and specification upgrades) and only 16% from unit volume expansion. Note that this 84% applies strictly to the incremental AI and data center TAM, not the entire CCL market. This underlines both the greatest opportunity and the primary vulnerability of the current cycle: flat unit volumes can consume far more layers of higher-grade, higher-ASP materials.
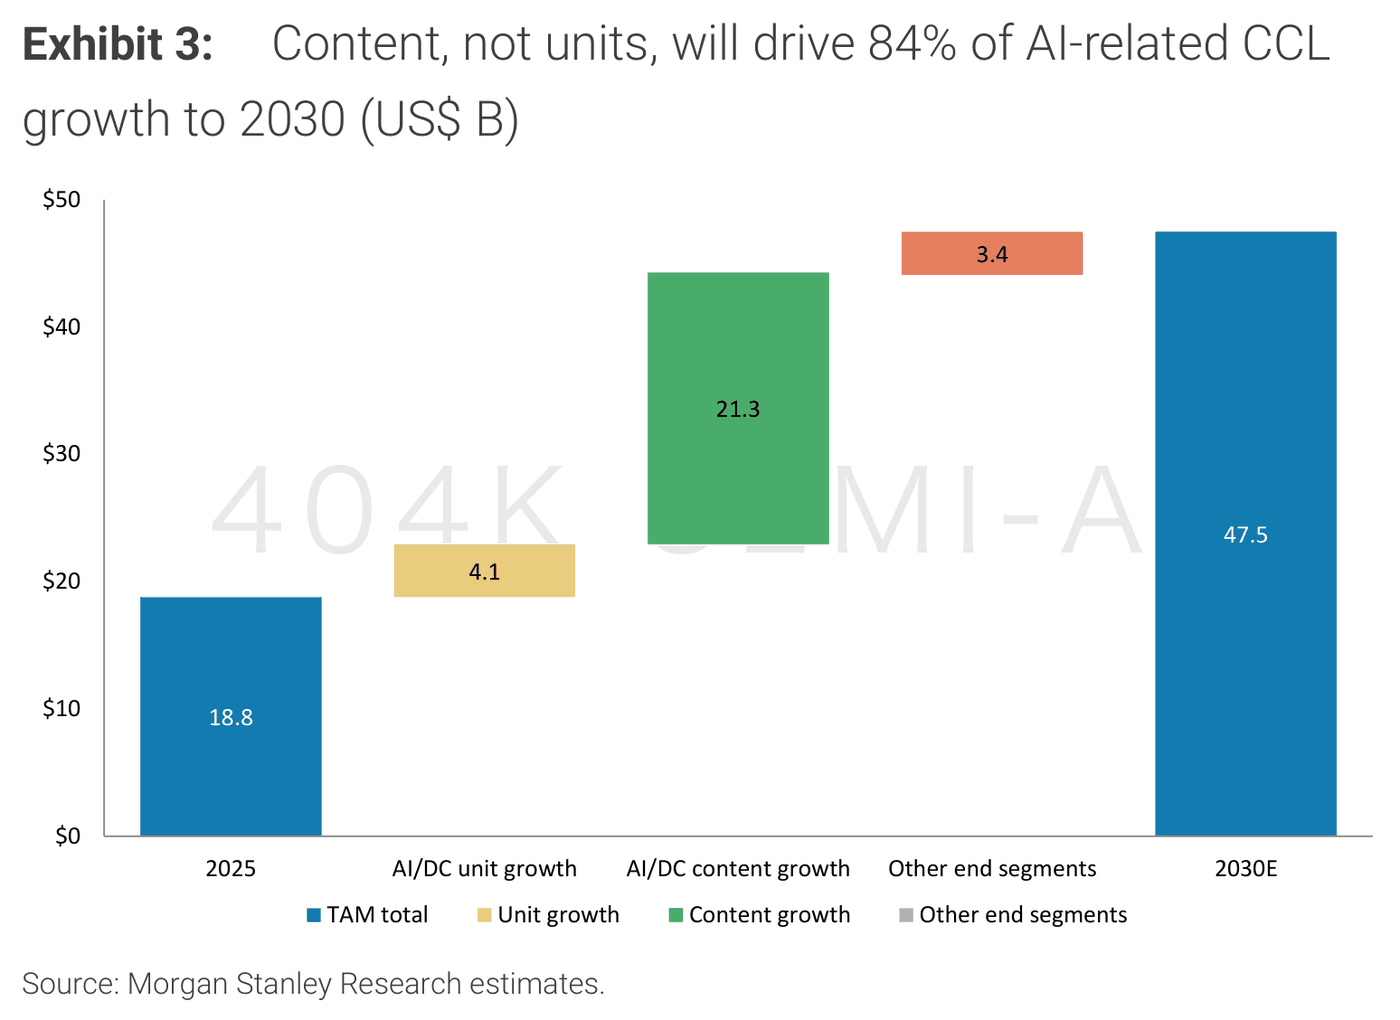
This dynamic fundamentally alters the analytical framework. Modeling material revenues solely on server unit shipment growth risks underestimating the upside from specification upgrades. Conversely, looking only at aggregate TAM risks overestimating how broadly benefits will accrue across suppliers. Low-tier material suppliers may see higher unit shipments without ever gaining access to top-tier orders. Meanwhile, qualified suppliers facing surging demand may still be constrained by raw materials, specialized tooling, and manufacturing yields, impairing their ability to deliver on schedule.
The structural composition of the PCB market is evolving in tandem. Morgan Stanley expects the global PCB market to grow from $58B in 2025 to $135B by 2030, with the AI and data center segment expanding from $13B to $86B, lifting its share from ~23% to ~64%. As industry growth shifts toward highly complex architectures, suppliers' earnings will increasingly hinge on their product mix.
Because CCL serves as an upstream input to PCBs, their market sizes are hierarchically nested rather than additive; summing them double-counts industry value. Furthermore, the "AI and data center" category encompasses general-purpose servers alongside AI compute, meaning not all incremental demand is driven purely by AI accelerators. Clarifying these two boundaries avoids double-counting capital expenditures across the value chain.
Why Copper Clad Laminates Are Bottlenecking High-Speed Compute
Composed of copper foil, resin, and reinforcement fabric, copper clad laminate forms the fundamental substrate of multilayer PCBs. Copper conducts electrical current, resin provides electrical insulation and bonding, and glass fabric delivers mechanical support. High-frequency, high-speed applications require concurrent upgrades across all three elements; upgrading a single raw material in isolation cannot resolve total system performance.
As signaling speeds climb, controlling transmission loss and signal integrity becomes increasingly difficult. Lower-loss resins, ultra-smooth copper foils, and glass fibers with superior dielectric properties mitigate electrical attenuation. Simultaneously, routing density, layer counts, and fabrication complexity increase significantly. Materials must not only hit target electrical metrics in laboratory testing, but also withstand downstream lamination, drilling, copper plating, and long-term reliability stress tests.
The real engineering challenge lies in the trade-offs between competing physical properties. Smoother copper foil surfaces reduce high-frequency conductor loss, but significantly weaken mechanical adhesion with resin. Altering resin formulations changes resin flow, curing profiles, thermal resistance, and processing windows. Suppliers must simultaneously balance low dielectric loss, peel strength, dimensional stability, and batch-to-batch consistency—making the technical barrier far higher than achieving any single lab specification.
Using the average selling price (ASP) of standard M2 material as a baseline of 1.0, Morgan Stanley indexes M7, M8, M9, and M10 materials at approximately 3.1x, 6.5x, 12.1x, and 17.3x, respectively. These are relative price multiples rather than absolute dollar quotes. While they demonstrate that higher material grades drive exponential gains in value per unit area, they cannot be translated directly into gross margins, as underlying raw material costs, manufacturing yields, and board thicknesses vary considerably.
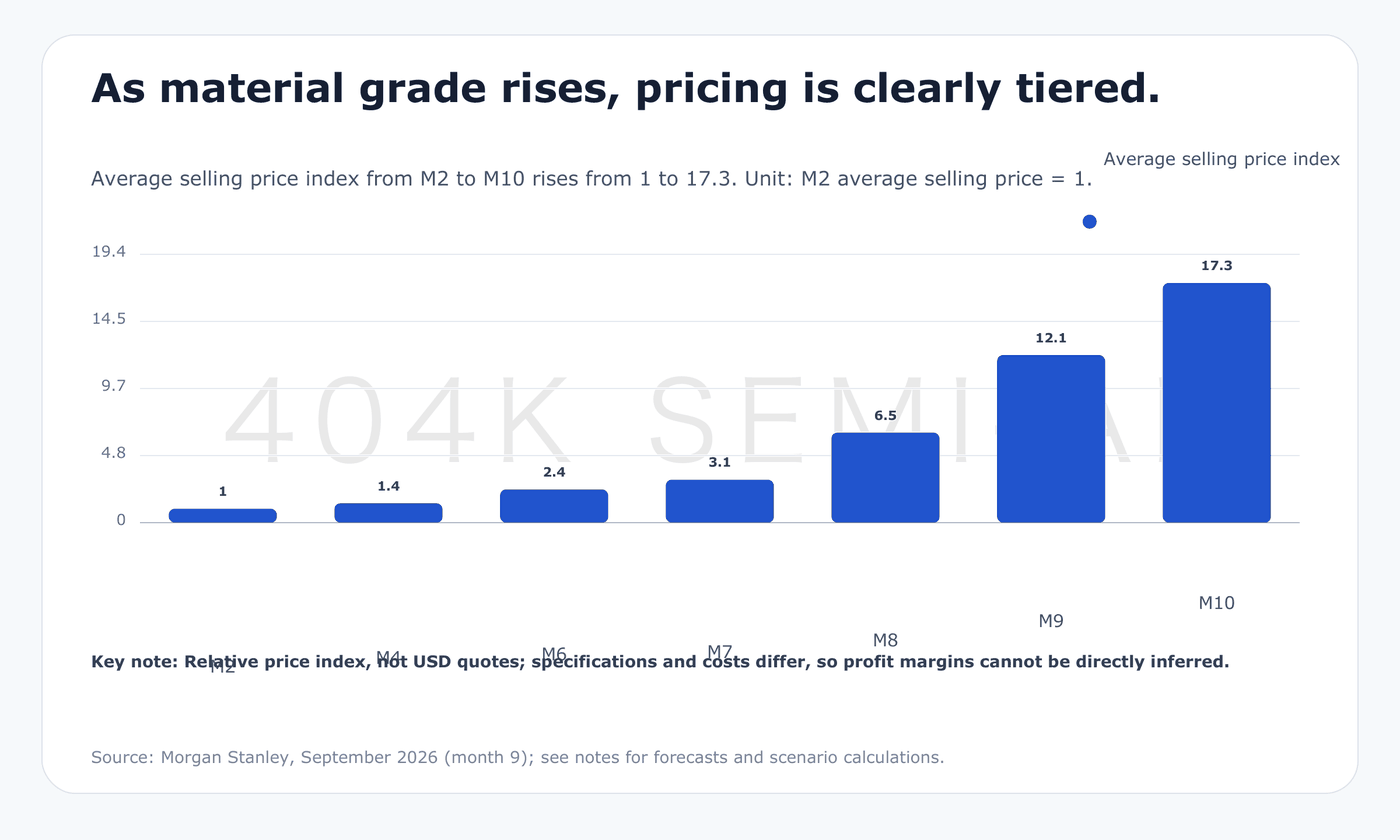
The supplier universe narrows precipitously at higher tiers. Morgan Stanley estimates that the number of qualified CCL vendors shrinks from roughly 8 for M7, to 6 for M8, and to 5 for M9. The competitive landscape for higher grades remains fluid and cannot be determined solely by current sampling progress. The decisive competitive moat is securing qualification within customer production programs and consistently meeting strict quality, delivery, and batch stability requirements at volume.
Full qualification for high-end CCL typically takes 12 to 18 months, creating substantial switching costs for customers. Swapping out a qualified material requires re-evaluating total board performance and end-to-end system reliability. Qualified incumbents thus enjoy order stickiness and privileged early engagement for next-generation designs. However, qualification on current platforms does not automatically grandfather vendors into future architectures; novel resin systems, new copper foils, or revised trace routing can reopen competitive bidding.
Qualification moats also constrain suppliers themselves. If upstream high-end raw materials face shortages or if production scaling compromises batch consistency, having design wins does not guarantee timely revenue recognition. Sustainable competitive advantage is therefore conditional: technical capability must pair with stable mass production, and customer relationships must be maintained across continuous architectural transitions. Tracking only patent counts, lab samples, or nameplate capacity ignores the steepest and most time-consuming hurdles of volume manufacturing.
Shifting Focus from Chip Counts to Rack-Level Material Dollar Content
The expansion in per-system dollar content is multiplicative. CCL demand can be expressed through a simplified framework: total platform rack/system shipments multiplied by board count per system, surface area per board, substrate layer count, and the blended ASP across material tiers. Shifts in any single variable alter the addressable market, but when multiple variables expand simultaneously, the resulting demand surge is non-linear.
Based on Morgan Stanley's engineering estimates, CCL dollar content per rack reaches approximately $6,695 for GB300, $18,750 for VR200, and $35,601 for VR300—with VR300 representing roughly a 5.3x increase over GB300. This jump reflects cumulative architectural changes, board-type proliferation, material tier upgrades, and overall system complexity, rather than a fivefold price increase for the same material.
Other platforms exhibit similar trajectories. Morgan Stanley estimates that CCL content per rack for Google's TPU climbs from $6,550 in v7 to $32,288 in v9, while AWS Trainium increases from $9,599 in Gen 2 to $32,789 in Gen 4. Estimated material content for AMD platforms shows comparable increases. This demonstrates that content growth is broad-based across AI architectures and not tethered to a single merchant silicon vendor.
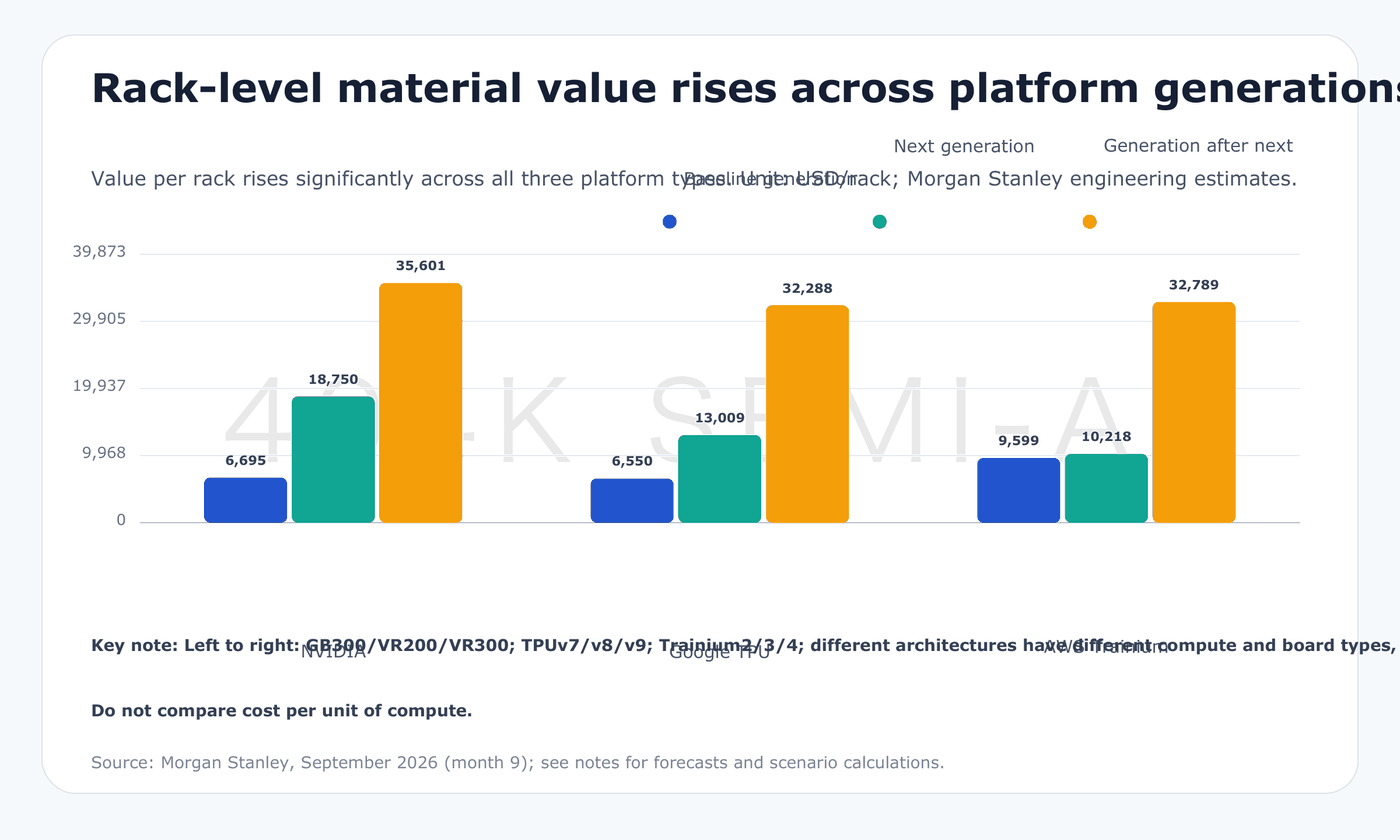
While cross-platform adoption provides demand diversification, comparing these figures directly as metrics of cost efficiency is misleading. Rack architectures differ vastly in chip count, aggregate compute density, board layout, and interconnect topology; a higher dollar content per rack does not imply higher material cost per unit of compute. To forecast vendor revenues, investors should focus on specific board types won, allocation shares, and actual volume shipments across each platform.
Furthermore, rack-level theoretical estimates should not be conflated with confirmed vendor purchase orders. Future platform architectures can be modified, material specifications may shift, and volume ramp timelines can slip. Market sizing models must be continuously calibrated against actual bill-of-materials (BOM) data, yield curves, and firm order books. The further out the forecast horizon, the heavier the reliance on engineering extrapolation, requiring greater scrutiny of platform-specific projections.
This framework also highlights a crucial timing dynamic. If a new platform slips by two quarters, structural material upgrades remain intact, but revenue shifts into subsequent fiscal periods. Meanwhile, newly installed equipment continues to incur depreciation, and pre-purchased raw materials tie up working capital. While the long-term secular demand trend is unchanged, intermediate earnings and valuation multiples can diverge sharply.
Morgan Stanley projects the AI and data center CCL market to grow from ~$4B in 2025 to ~$30B by 2030. These rounded figures are indicative macro benchmarks rather than inputs for precise annual share calculations. Nonetheless, the structural trend is unmistakable: revenue outperformance will be driven by exposure to high-dollar-content platforms rather than a broad-based cyclical recovery across legacy electronics.
Longer Lead Times: Capacity Expansion Goes Beyond Tool Counts
Supply in high-end electronic materials cannot be measured simply by floor space or tool counts. Actual shippable output is heavily constrained by takt times, yield curves, product specification matching, and program qualification scopes. As architectural complexity rises, the divergence between nameplate capacity and effective, qualified yield widens significantly.
Morgan Stanley estimates that total manufacturing lead time expands from ~46 days for standard PCBs to ~102 days for advanced AI PCBs—a 2.2x increase. Specifically, glass fabric processing lengthens from ~13 to 28 days, CCL fabrication from 14 to 25 days, and PCB board processing from 10 to 40 days. (Because upstream processes operate partially in parallel, total cycle time is not a simple linear sum of individual steps.)
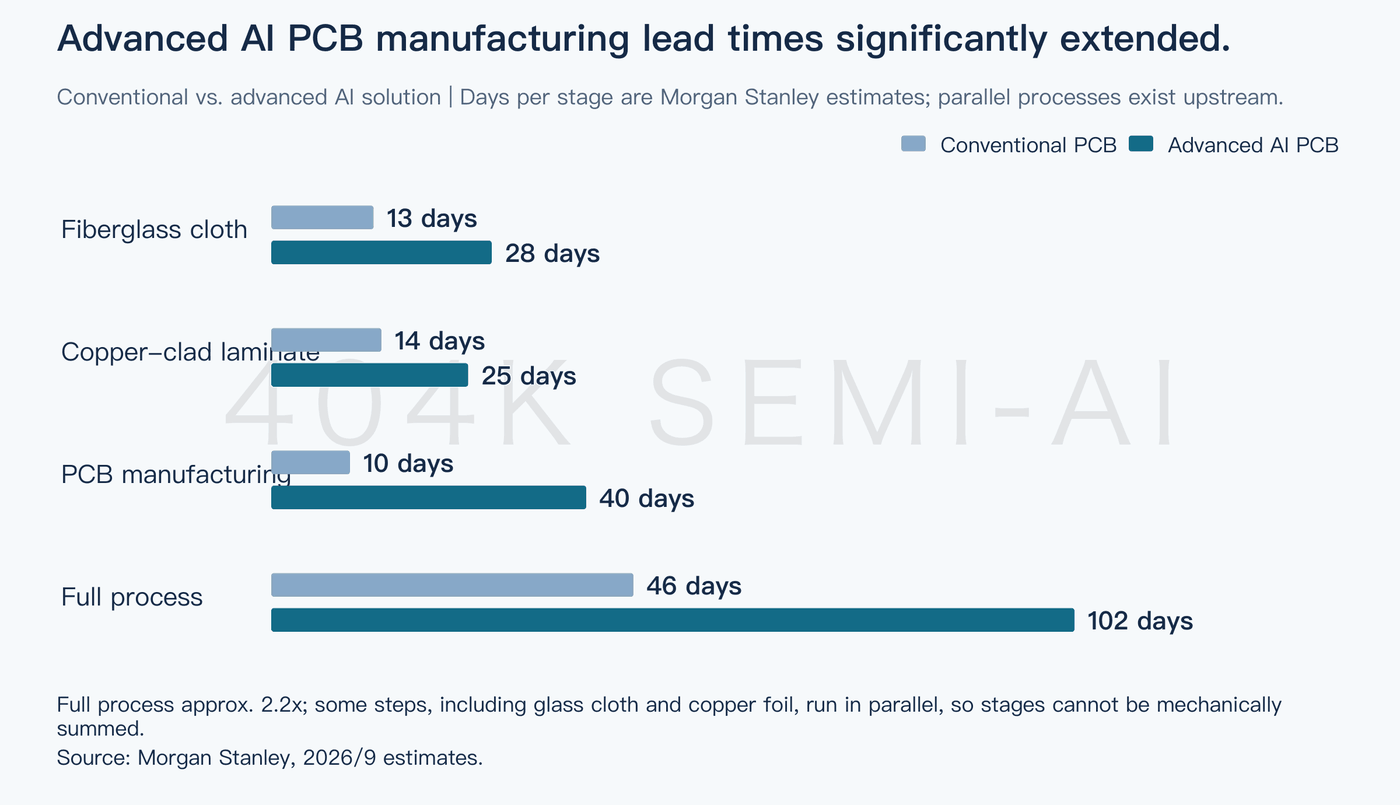
For suppliers, extended processing times mean higher work-in-progress (WIP) inventories, complex production scheduling, and prolonged working capital absorption. Even with robust order backlogs, the same machinery produces fewer shippable units over any given period. Furthermore, when high-end and legacy products share upstream production lines, upgrading to advanced tiers can cannibalize capacity for commodity grades, transmitting supply bottlenecks into broader markets.
Copper foil exemplifies this dynamic. Morgan Stanley estimates that transitioning lines from HVLP2 to HVLP4 can reduce effective tonnage output by more than 40%, with new line yield ramps taking 6 to 12 months. Nameplate tonnage calibrated for legacy grades cannot be converted 1:1 into shippable volume for advanced grades. Slower line speeds and tighter quality tolerances inherently erode apparent capacity.
Reported capacity additions among CCL manufacturers must be interpreted through the same lens. Morgan Stanley forecasts monthly capacity at Elite Material Co. (EMC) to expand from 5.85M sheets in 2025 to 11.25M sheets by year-end 2028, and Taiwan Union Technology Corp. (TUC) from 2.30M sheets to 5.30M sheets. These figures represent year-end nameplate sheet counts, which cannot be equated to average monthly qualified output during the year. Moreover, the economic value per sheet varies drastically across specifications, thicknesses, and product mixes.
Capacity expansion may eventually alleviate shortages, but it frequently exerts near-term margin pressure. Once new tools are installed, depreciation, labor, and qualification expenses start immediately; if customer sign-offs or upstream raw material supplies lag, revenue will not ramp in tandem. Fixed costs per unit dilute only after yields, utilization rates, and shipment volumes cross critical thresholds. Rising capital expenditures signal future potential supply, not guaranteed profit realization.
Cash flows experience a comparable lag. Bulging inventories, extended manufacturing cycles, and higher accounts receivable can consume the headline earnings growth shown on the income statement. Evaluating expansion success requires viewing gross margin improvements alongside operating cash flow, inventory turnover, and capex. When top-line revenue surges while cash conversion lags persistently, the business is effectively fronting the capital for subsequent expansion cycles.
The Copper Foil Opportunity: Processing Capabilities and Effective Supply
The investment thesis for HVLP (Heavy Very Low Profile) copper foil differs fundamentally from standard cyclical copper commodity plays. Its value proposition centers on surface morphology control, batch consistency, and chemical treatment precision. Morgan Stanley’s analysis focuses strictly on electronic circuit foil for rigid PCBs, excluding lithium-ion battery foil and IC substrate foil; conflating these disparate segments distorts supply-demand dynamics and competitive moats.
Morgan Stanley estimates that the rigid PCB copper foil market will grow from ~$5.0B in 2025 to ~$9.6B by 2030, a CAGR of ~14%. High-end segments will outpace the overall market, albeit starting from a much smaller baseline. The rapid growth of HVLP4 and higher tiers cannot be extrapolated across the broader foil industry, nor can it substitute for firm-level product mix analysis.
Processing fees (treatment margins), rather than underlying LME copper prices, govern profitability. Indexing the processing fee of standard HTE or RTF foil at 1.0, Morgan Stanley benchmarks HVLP1/2, HVLP3, HVLP4, and HVLP5+ at 3.0x, 5.0x, 7.5x, and 10.0x, respectively. Raw copper costs are generally passed through via formulaic pricing mechanisms; while copper price increases lift headline revenue, they do not inherently expand processing gross profit. High-end product share, unit processing premiums, and scrap rates represent the critical operating variables.
Supply-demand modeling highlights potential bottlenecks centered in HVLP4. Morgan Stanley projects average monthly demand and supply in 2026 to be roughly balanced at ~1,028 tons vs. ~1,080 tons. By 2027, however, monthly demand surges to 3,270 tons against supply of ~2,495 tons; in 2028, demand reaches ~4,335 tons against ~3,600 tons of supply. In this framework, the demand ramp outstrips the pace of qualified supply additions.
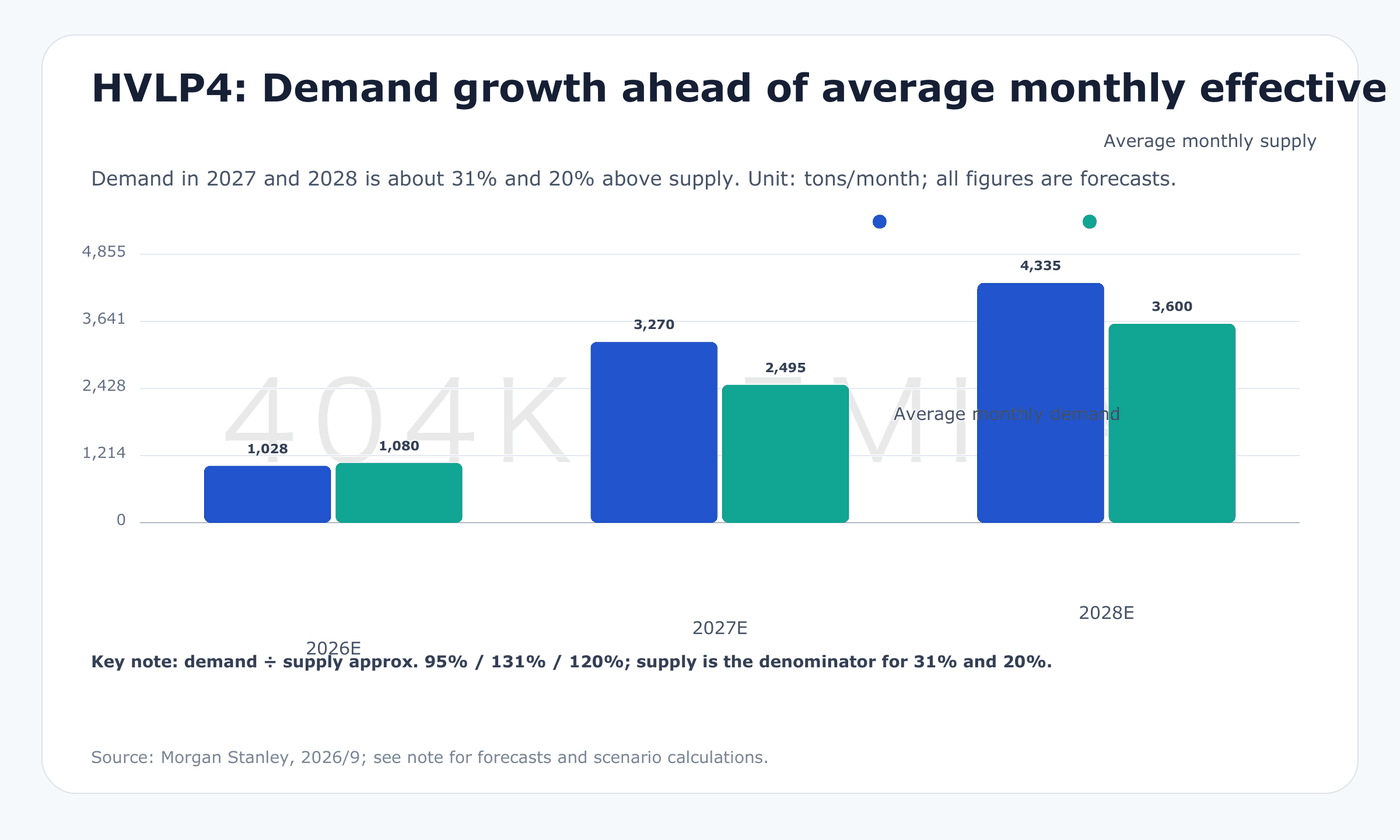
Expressed relative to supply, demand exceeds available capacity by ~31% in 2027 and ~20% in 2028. Expressed as a percentage of total demand, the static unfulfilled gap is ~23.7% and ~17.0%, respectively. Both formulations illustrate a tight market. However, these figures reflect static gaps modeled under fixed pricing, baseline platform rollouts, and existing expansion plans; they do not imply that orders will remain permanently unfulfilled in the real world.
Higher pricing incentivizes accelerated capacity additions while prompting downstream customers to explore material substitutions, delay purchases, or redesign architectures. Conversely, yield learning curves may ramp faster than anticipated, or demand may soften if server platforms slip. Supply deficits are inherently dynamic: while projections of tightness support resilient processing fees for premium grades, they do not imply unconstrained pricing power.
Capacity metrics for Co-Tech Development Corp. (Co-Tech) require careful delineation. Morgan Stanley estimates its year-end 2027 monthly HVLP4 capacity at 700 tons, or 740 tons including HVLP5; yet the annualized model assumes an average monthly effective supply of only 510 tons for that year. Distinguishing exit run-rates from annual averages, and standalone grades from blended totals, is critical. Multiplying the 740-ton year-end figure by 12 would substantially overstate the effective supply incorporated into the 2027 balance sheet.
The competitive landscape is also diversifying. Morgan Stanley projects the combined HVLP4 capacity share of the top five vendors to decline from 88% in 2026 to 76% by 2028. Rapid industry growth does not necessarily reinforce supplier concentration. While first movers capture early platform volume, earnings models must factor in processing fee erosion as secondary suppliers qualify.
How High-End Glass Fabric Upgrades Spill Over into Commodity Materials
Glass fabric provides far more than structural reinforcement. Low dielectric constant (Dk) and low coefficient of thermal expansion (CTE) directly impact high-speed signal integrity and dimensional stability under thermal stress. In advanced CCLs, glass fabric, resin systems, and copper foil co-determine overall substrate performance; upgrading fabric specifications sharply elevates total material costs and qualification thresholds.
In Morgan Stanley’s pricing benchmarks for glass yarn, LowDK1, LowDK2, and LowCTE are indexed at approximately 2.1x, 8.0x, and 10.7x the price of standard E-glass yarn, respectively. These multiples reflect relative yarn pricing rather than finished fabric quotes. Weaving yarn into fabric involves downstream processing where fabric thickness, weave density, and yarn quality dictate final commercial value.
The transition to advanced materials also exerts indirect pricing pressure on commodity E-glass. When manufacturers reallocate kilns and weaving capacity toward premium grades, supply elasticity for standard grades diminishes. Even with modest demand growth in legacy end-markets, commodity prices can rise sharply due to supply-side displacement. This grants commodity producers cyclical margin expansion, though the underlying driver is supply-side tightening rather than structural qualification moats.
Morgan Stanley’s index for standard E-glass yarn prices (benchmarked to 1.0 in September 2025) rose to ~3.7 by August 2026 and was projected at 4.1 for September 2026 (with the latter remaining an estimate). This trajectory demonstrates how AI-driven demand can indirectly lift legacy materials, though this index cannot be assumed to translate 1:1 into price gains across all yarn, fabric, or finished CCL products.
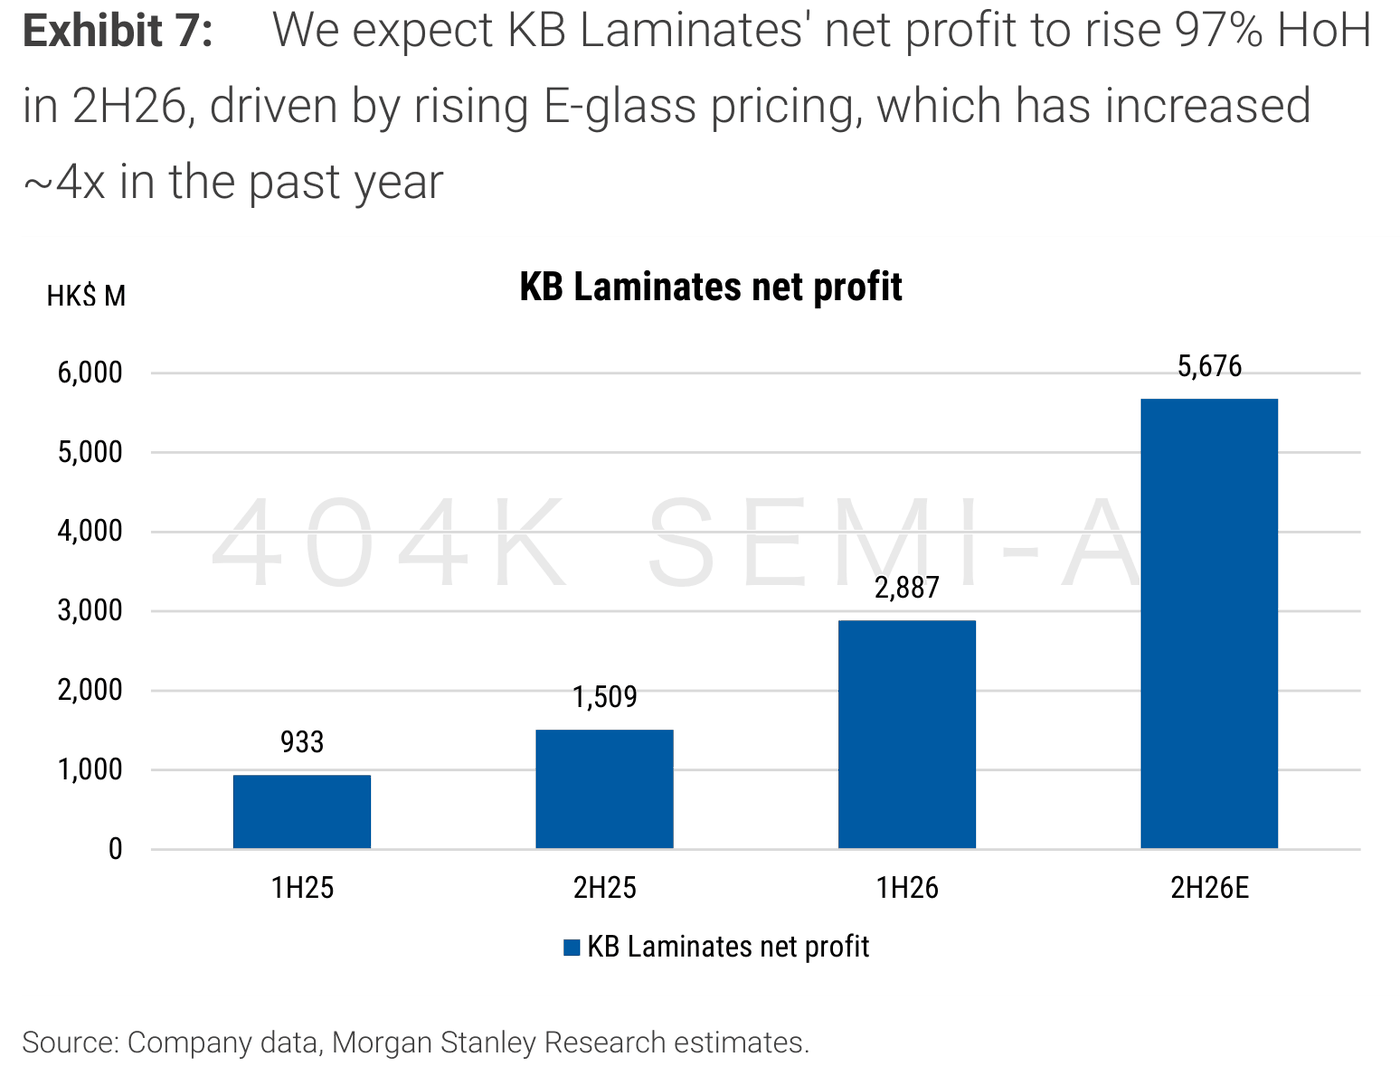
Kingboard Laminates illustrates this profit transmission. Citing company data, Morgan Stanley highlighted that Kingboard's electronic glass yarn and fabric segment generated over HK$600M in profit in 2025 and ~HK$1.0B in 1H26, contributing ~35% of total group earnings. Backward vertical integration into upstream raw materials provides the company with significant cost shielding and margin capture during upstream price spikes compared to non-integrated peers.
However, the impact of price hikes diverges across the supply chain. Rising upstream ASPs benefit yarn and fabric manufacturers, but squeeze margins for downstream CCL and PCB fabricators unable to pass cost increases along promptly. Furthermore, vertical integration carries structural trade-offs: firms must carry heavy upstream fixed assets, working capital, and raw material cyclicality. When demand cools, these capital-intensive upstream assets can swiftly transform from profit engines into cost burdens.
Morgan Stanley forecasts Kingboard Laminates' 2H26 net profit at ~HK$5.68B, up ~97% compared to HK$2.89B in 1H26—an aggressive earnings acceleration assumption. Concurrently, gross margin is modeled to peak at 44.1% in 2027 before receding to 41.7% in 2028, baking in partial cyclical normalization. Evaluating such elevated near-term earnings requires weighing price sustainability against impending supply responses.
Five Companies, Five Distinct Profit Drivers
Elite Material Co. (EMC)'s core investment thesis rests on its technical leadership, Tier-1 customer qualifications, and manufacturing scale in high-end CCL. Its growth depends on qualifying higher material grades, expanding allocation across flagship AI platforms, and converting capacity additions into consistent volume shipments. During platform expansions, these three pillars reinforce one another; however, any shift in baseline material roadmaps would force EMC to requalify and defend its position.
Morgan Stanley models EMC’s diluted EPS to surge from NT$122.17 in 2026 to NT$416.24 by 2028. Delivering on this aggressive trajectory requires concurrent top-line volume growth, structural mix enrichment, and operating leverage. If volume expands without the projected high-end mix enrichment and margin expansion, earnings will fall short of this modeled path. Furthermore, secure upstream allocations of specialty copper foil and glass fabric will directly dictate how much customer demand EMC can service.
Taiwan Union Technology Corp. (TUC) is best understood through its specific customer and platform footprint. Morgan Stanley notes that TUC has lower direct exposure to Nvidia, with non-Nvidia AI platforms and high-speed networking representing its primary growth engines. While cross-platform upgrades offer substantial opportunities, realization schedules depend on each customer's specific production ramp. Investors cannot simply map Nvidia rack content gains 1:1 onto TUC's revenue trajectory.
TUC's nominal monthly capacity is projected to expand aggressively from 2.30M sheets in 2025 to 5.30M sheets by year-end 2028. The central operational question is whether this new capacity can secure qualified volume orders fast enough, and whether the high-end mix can absorb the incremental depreciation burden. Morgan Stanley forecasts TUC’s 2028 EPS at NT$156.68, a projection tightly coupled to smooth capacity ramps, qualification wins, and high line utilization.
Co-Tech Development Corp. (Co-Tech) represents a pure-play on copper foil spec upgrades. Expanding processing fees for advanced grades, capacity additions in HVLP4+, and market share dynamics dictate its earnings leverage. Positioned upstream of CCL vendors, its realized profits hinge on customer concentration, periodic fee negotiations, and volume yield capabilities in premium grades. Assessing Co-Tech requires tracking qualified tonnage and product mix rather than headline revenue or copper price movements.
Kingboard Laminates combines cyclical exposure to commodity laminate pricing with deep upstream vertical integration. Surging earnings from electronic glass yarn and fabric can accelerate group profits rapidly, but falling commodity laminate prices can reverse that operating leverage just as quickly. Evaluating Kingboard requires monitoring upstream spot prices, cost pass-through efficiency, and plant utilization, rather than relying strictly on the multi-quarter qualification framework applied to high-end CCL vendors.
Shengyi Technology presents a clear distinction between fundamental industry standing and stock valuation. Although Morgan Stanley raised its price target on Shengyi from RMB 74 to RMB 170, it maintained an Equal-weight rating—illustrating that upgraded earnings expectations do not automatically warrant an upgraded investment rating. The degree to which growth is priced in and the prerequisite conditions for long-term earnings heavily shape the investment conclusion. Morgan Stanley also factored potential transitions toward PTFE resin systems into its competitive scenarios, though broad commercial adoption remains unconfirmed.
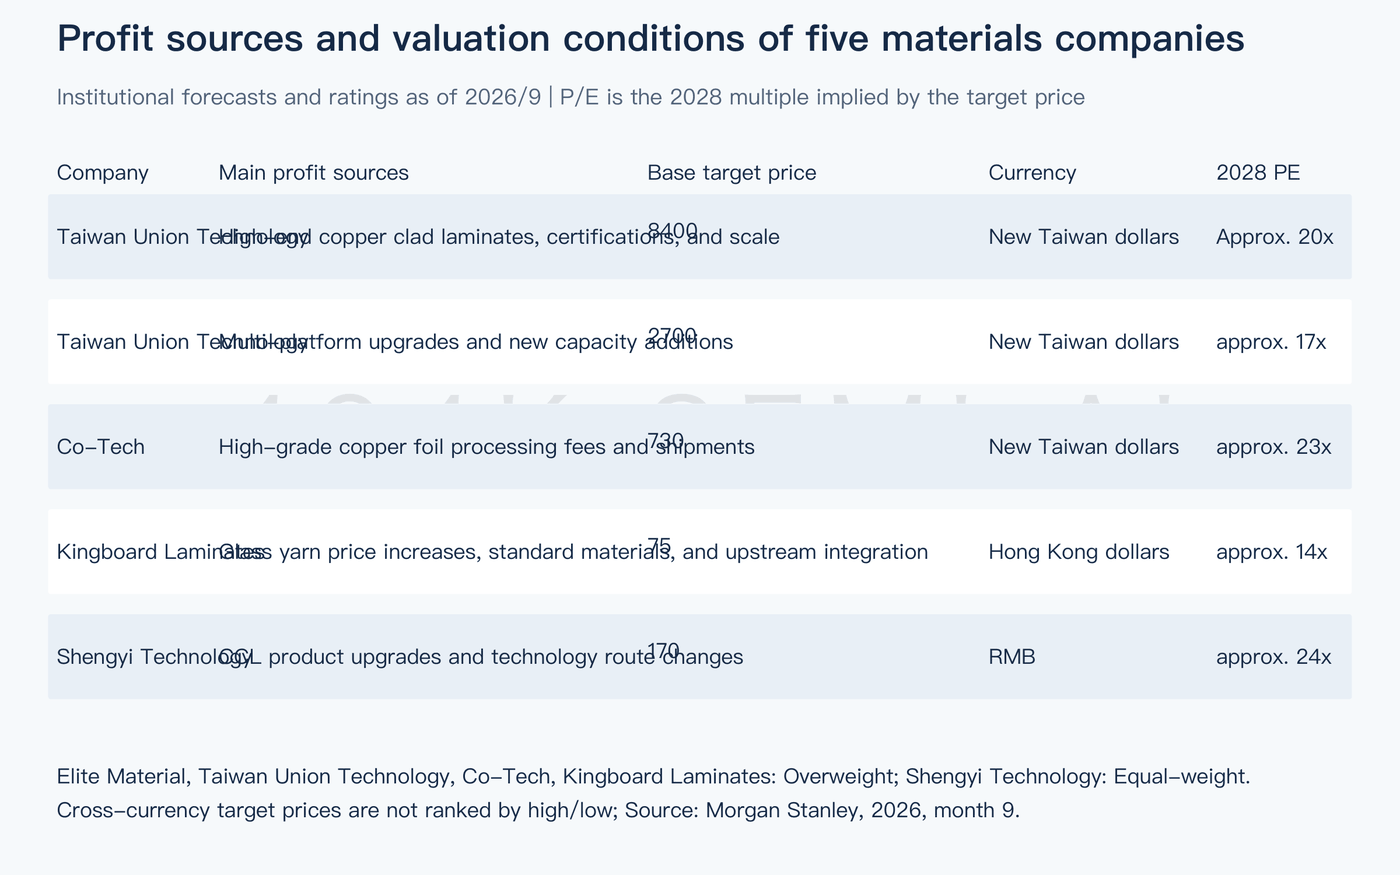
Because price targets across these five companies span different local currencies (NT$, HK$, RMB), capital structures, and business models, nominal target values cannot be compared directly. Morgan Stanley assigned Overweight ratings to EMC, TUC, Co-Tech, and Kingboard Laminates, while maintaining an Equal-weight rating on Shengyi Technology. Evaluating these thesis calls requires examining what each company sells, to whom, at what margins, and at what cash capital cost.
By the same token, producing scarce materials does not automatically translate into superior shareholder returns. If a firm overexpands, overpays for tooling, or concedes pricing to secure flagship Tier-1 accounts, return on invested capital (ROIC) can disappoint even amid an industry upcycle. Order quality, customer concentration, and cash conversion ultimately determine how much economic value is captured.
Key Long-Term Assumptions Underpinning High Price Targets
Morgan Stanley primarily uses residual income models (RIM) to value these companies. The core premise is that a firm's current book value provides the baseline; value is created only when projected returns on equity exceed the cost of equity, with those economic profits discounted back to the present. High earnings growth must be accompanied by sustained returns above the cost of capital to justify premium multiples.
This approach is more rigorous than applying a static P/E multiple to a single year's earnings. Morgan Stanley's price targets—NT$8,400 for EMC, NT$2,700 for TUC, NT$730 for Co-Tech, HK$75 for Kingboard Laminates, and RMB 170 for Shengyi Technology—imply 2028 P/E multiples of roughly 20x, 17x, 23x, 14x, and 24x, respectively. These multiples represent an alternate expression of the residual income output rather than the primary driver of valuation.
Taking EMC as an example, multiplying the projected 2028 EPS of NT$416.24 by ~20x yields ~NT$8,325, aligning closely with the NT$8,400 target. The arithmetic is straightforward; the real uncertainty lies in whether NT$416.24 in EPS can be delivered, and whether the market will still award a 20x multiple in 2028. Scrutinizing the earnings quality and probability of those out-year profits is far more critical than anchoring to nominal price targets.
Morgan Stanley’s bull and bear scenarios span wide ranges: NT$13,000 vs. NT$4,000 for EMC, and NT$4,050 vs. NT$675 for TUC. This wide dispersion underscores the reflexive compounding of platform execution, profitability, and exit multiples. These scenario bands are not statistically weighted probability distributions, and the midpoint should not be interpreted as an expected return.
Out-year earnings and valuation multiples tend to move in tandem. If high-end capacity ramps faster than anticipated, earnings estimates will be cut just as the market de-rates terminal multiples. Conversely, if technical moats prove more durable, earnings will beat consensus and the duration of excess returns will extend. Modeling EPS without analyzing the competitive durability of those returns misses the core pricing lever.
Cost of capital assumptions also heavily influence valuation outcomes, though published parameters exhibit discrepancies. In certain Taiwan-listed models, Morgan Stanley cites a 9.3% cost of equity, yet the individual risk-free rates, equity risk premiums, and betas disclosed do not reconcile mathematically to that figure. Price targets should therefore be understood as broker model outputs rather than independently verifiable reconciliations. While this does not undermine underlying operational data, it limits the transparency of the DCF/RIM math.
The central financial question is whether growth will require disproportionate capital reinvestment. If robust accounting profits are drained by ongoing capex and expanding working capital, cash distributions to shareholders will be deferred. Furthermore, if advanced materials commoditize faster than expected, the window of economic rent capture will narrow. Translating TAM forecasts into equity value requires rigorous stress-testing across market share, operating margins, capital efficiency, and competitive longevity.
Stress-Testing the Growth Model
The market model for CCL decomposes into System Volume × Dollar Content per System, which inherently magnifies multiplicative downside. Taking Morgan Stanley’s rounded 2030 AI and data center CCL baseline of ~$30B: if system shipments come in 15% below assumption and per-system dollar content comes in 10% lower, the resulting TAM falls to ~$22.95B—a 23.5% contraction from the base case.
This sensitivity calculation is purely mechanical rather than a revised forecast. It does not account for price elasticity, capacity rationalization by suppliers, or material substitution by end-customers. Its utility lies in demonstrating how modest, non-extreme deviations across dual inputs compound into meaningful deviations in top-line TAM.
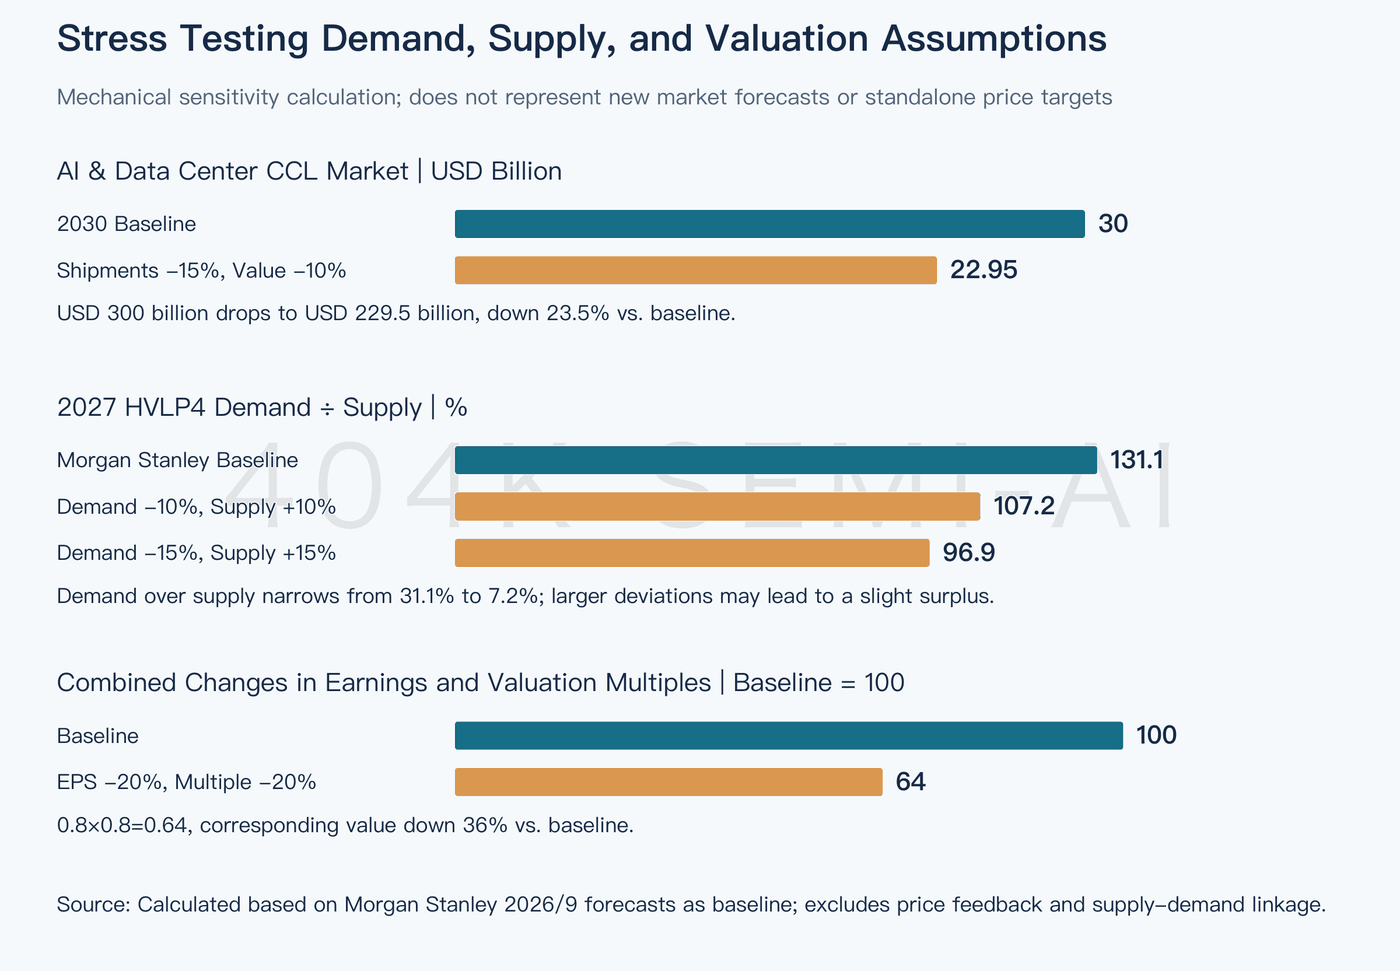
The anticipated copper foil deficit can be evaluated through the same lens. In 2027, monthly HVLP4 demand of 3,270 tons against supply of 2,495 tons leaves a static monthly shortfall of 775 tons. If demand tracks 10% below base case while supply comes in 10% higher, demand shifts to ~2,943 tons against ~2,744.5 tons of supply. The deficit shrinks to 198.5 tons, and the excess of demand over supply contracts from ~31% to ~7.2%.
This does not invalidate the undersupply thesis, but it illustrates how sensitive supply tightness is to platform launch schedules and yield improvements. If both sides deviate by 15%, demand drops to ~2,779.5 tons against supply of ~2,869.3 tons, tipping the model into a slight surplus. Because supply and demand are rarely independent, actual market clearing will involve dynamic adjustments across pricing, buffer stock, and capex timing.
Crucially, these deviations are often correlated. If a customer delays a platform rollout, it simultaneously reduces near-term shipments, postpones advanced material transitions, and leaves supplier capacity underutilized—depressing volume, ASPs, and gross margins all at once. Conversely, faster customer qualifications spark positive reflexive momentum. Modeling sensitivity via isolated variables understates this correlated volatility.
Multiplicative compounding is equally pronounced in valuation. If a company’s out-year EPS misses expectations by 20% and the market concurrently awards a 20% lower multiple, the resulting equity value drops by 36%. (This math serves strictly to illustrate valuation sensitivity when fundamentals and market multiples de-rate concurrently, rather than to establish independent price targets.)
Management execution determines how these pressures manifest across corporate balance sheets. Delaying capacity additions conserves liquidity but risks forfeiting market share; proceeding with aggressive expansion defends competitive positioning but elevates fixed depreciation and idle capacity burdens. Suppliers carrying high inventories are vulnerable to platform delays, whereas vendors with diversified customer and product portfolios maintain greater flexibility to reallocate manufacturing lines. Consequently, identical macro headwinds will yield highly divergent earnings and cash flow outcomes across peers.
The primary purpose of stress-testing is to identify the pivotal operational variables to monitor. For high-end CCL, track whether material spec transitions keep pace with platform roadmaps. For copper foil, monitor whether monthly qualified yield ramps outstrip conservative expectations. For glass fabric and commodity laminates, observe how customer procurement and secondary supply react to price hikes. These operational indicators, rather than headline macro estimates, drive earnings inflections.
Catalysts That Could Shift the Current Material Cycle
Structural shifts in material science pose far deeper risks than quarter-to-quarter shipment fluctuations. If alternative resin platforms, such as PTFE (polytetrafluoroethylene), see widespread adoption, they could disrupt established resin systems, PCB fabrication processes, and supplier allocations. While Morgan Stanley analyzed these scenarios, commercial adoption across next-generation platforms remains unconfirmed. Assessing technological disruptions requires tracking validated design wins and volume production commitments, rather than assuming technical R&D; capabilities guarantee commercial share.
Co-Packaged Optics (CPO) could fundamentally redraw the transmission path of high-speed electrical signals. By transitioning electrical interconnects to optical links closer to the ASIC, content value migrates toward advanced packaging, IC substrates, and optical components, potentially bypassing high-tier CCL in specific interconnect topologies. Morgan Stanley notes that near-term hurdles in thermal management, packaging yields, cost, and field reliability continue to defer broad CPO deployment; however, these constraints merely govern the adoption timeline rather than guaranteeing the permanence of current copper-based substrates.
Supply chain inventory build and precautionary buffer stocking represent the most immediate metrics to watch. As total manufacturing lead times extend from 46 to 102 days, downstream customers naturally pull forward orders to mitigate line-down risks. As a result, order surges reported by material suppliers likely blend genuine end-demand with safety stock accumulation. If supplier lead times compress and channel inventories climb without a commensurate rise in hyperscaler rack deployments, order book durability must be reassessed.
Effective supply expansion can materialize ahead of greenfield capex. Yield curve steepening, debottlenecking of plating or treating lines, and qualification approvals can rapidly expand shippable volume without requiring proportionate greenfield capital expenditures. When monitoring capacity, monthly qualified run-rates and product tier mix provide the most reliable signals. Relying exclusively on year-end nameplate announcements risks either overestimating near-term supply or missing operational efficiency gains that soften supply tightness ahead of schedule.
Pricing trends must be evaluated in context with shipment volumes and margin quality. Sustained pricing power in premium treatment fees alongside rising shipment volumes confirms robust earnings quality. Conversely, if rising blended ASPs merely reflect a shrinking commodity base or pass-through metal inflation, the margin implications are materially different. In commodity segments, if glass yarn prices surge while downstream PCB orders soften, it indicates that upstream cost spikes are crimping end-market demand, shortening the duration of peak margins.
Financially, three operational pairings warrant close inspection:
Top-line revenue growth accompanied by a rising share of premium-tier products.
Gross margin expansion backed by stable manufacturing yields.
Accounting earnings growth converting progressively into operating cash flow.
Isolated metrics are susceptible to distortion; simultaneous improvement across these three operational vectors provides the only definitive confirmation that a supplier is capturing sustainable value from structural spec upgrades.
Morgan Stanley’s projections set a critical verification window for 2027–2028: high-dollar-content platforms enter high-volume manufacturing, the HVLP4 supply deficit widens, and newly built capacity across multiple vendors comes online. Both supply and demand will face rigorous market tests during this period. If spec upgrades progress smoothly and qualified supply continues to lag demand, leading material suppliers will preserve strong pricing power. If, however, new capacity qualifies faster than anticipated while platform dollar-content gains underwhelm, current earnings forecasts and valuation multiples will face concurrent downward revisions.
Ultimately, the most informative signals will be whether program qualification wins, volume ramp cadences, qualified shipment volumes, treatment margins, and cash conversion corroborate one another. While AI infrastructure buildouts provide an expansive TAM narrative, the enduring equity value of material suppliers will be decided by operational execution and cash flow realization.