
目录
The Answer Is Finished, but the Data Is Not
How Much Storage Do One Million Agent Tasks Ultimately Leave Behind?
When Memory Fills Up, SSDs Absorb the Data That Can Least Afford to Wait
SSDs Are Getting Larger, but HDDs Still Carry the Biggest Cold-Data Bill
Simultaneous Growth in Both Media Is the Most Important Signal
Software Compression Will Reshape Tiering but Is Unlikely to Eliminate Aggregate Demand
How Storage Demand Flows into Revenue, Profit, and Cash Flow
The Three Scenarios Hinge on Whether Task Growth Outpaces Efficiency Gains
How to Read the Public Data over the Next Four Quarters
Storage Ultimately Has to Satisfy Two Economic Tests
After an AI task finishes, the model must still preserve context, checkpoints, indexes, and logs. Access frequency determines whether this data resides on enterprise SSDs or nearline HDDs—and where NAND and HDD vendors capture value.
The Answer Is Finished, but the Data Is Not
Completing an inference task only means the GPUs have stopped generating the answer. Enterprises may still retain session context, agent trajectories, vector indexes, model checkpoints, tool-call logs, and synthetic data. Any data that may be reused turns from a computational byproduct into a storage requirement.
This highlights an often-underestimated shift in AI infrastructure. GPUs determine how many tokens a model can process per second; storage systems determine how quickly prior outputs can be retrieved. Slow retrieval leaves expensive GPUs idle, while keeping everything on high-performance media causes capacity costs to rise rapidly.
Cloud providers therefore need to tier their data. Data likely to be reused soon, involving highly random access, or whose recovery speed affects GPU utilization generally sits closer to enterprise SSDs. Very large datasets with declining access frequency and longer retention periods are better suited to nearline HDDs. Data temperatures also change: the same data may begin as active content on SSDs, migrate to HDDs, and later be recalled when needed.
The table below is a workload ledger illustrating typical engineering choices; it does not imply that every cloud provider uses the same retention policy.
AI data temperature determines reuse frequency, retention period, and storage tier
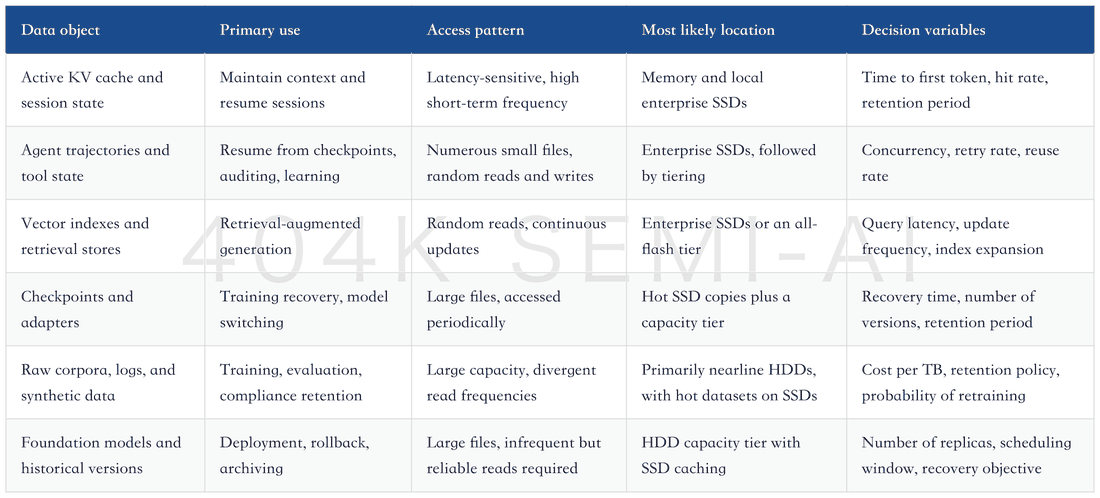
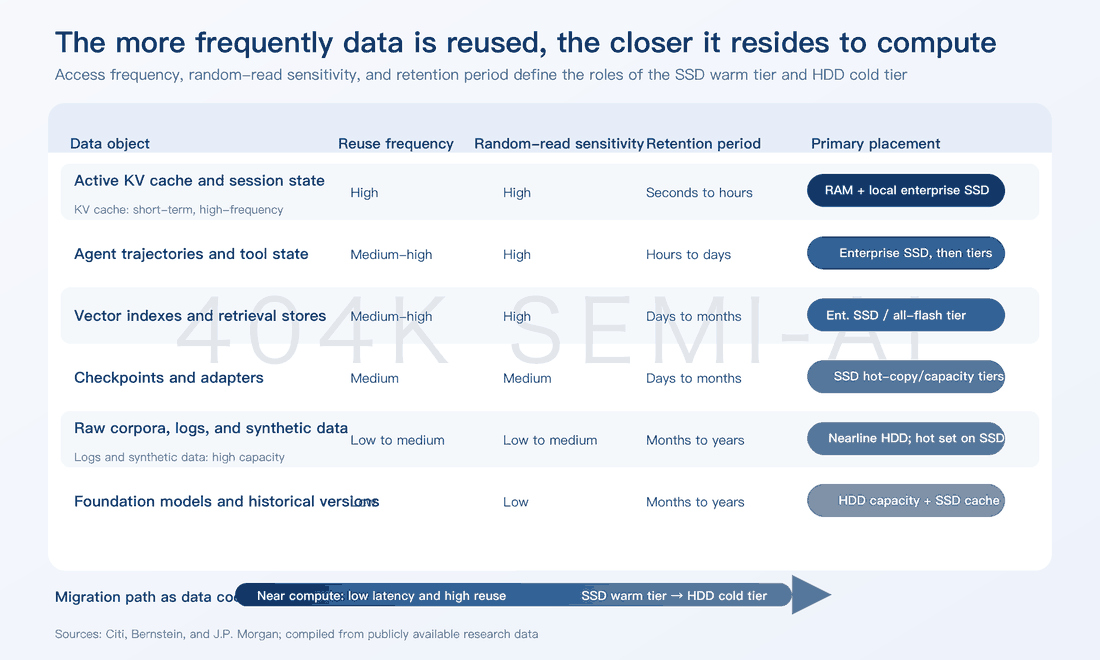
This ledger decomposes storage demand into two multipliers: how much retainable data each task generates and how long that data is kept. Call volume indicates only the number of tasks and cannot by itself determine storage procurement. If enterprises expand context windows, add agent steps, and retain more trajectories, the per-task data footprint will also increase.
How Much Storage Do One Million Agent Tasks Ultimately Leave Behind?
Storage demand can be calculated from each completed task. The number of valid tasks completed each day determines incremental data flow; the amount of retained context, trajectories, indexes, and intermediate outputs determines the footprint per task; and retention periods, replication, compression, and deduplication together determine the final stored volume.
Daily incremental data ≈ valid tasks per day × retainable data per task
Effective stored volume ≈ daily incremental data × average retention in days × replication factor ÷ compression and deduplication factor
Warm-data SSD demand ≈ effective stored volume × warm-data share
Cold-data HDD demand ≈ effective stored volume × cold-data share
A purely illustrative scenario shows how these multipliers work. Assume a platform completes 1 million valid agent tasks per day, ultimately retains 100MB per task, and keeps the data for an average of 180 days. The system stores two replicas, while compression and deduplication reduce capacity requirements by half. With replication and compression offsetting each other, effective stored volume is approximately 18PB. If 30% is warm data requiring faster recovery, approximately 5.4PB resides on SSDs; the remaining 70% moves to the cold tier, with approximately 12.6PB handled by HDDs or other capacity media.
These parameters illustrate the mathematical relationship only; they do not represent any cloud provider’s actual configuration or an industry forecast. Changing the per-task footprint to 10MB or 1GB, or the retention period to 30 days or 365 days, shifts the result by an order of magnitude.
Retention period and per-task footprint jointly determine effective stored volume

Note: The table assumes 1 million valid tasks per day and a replication-factor-to-compression-and-deduplication-factor ratio of 1. Task definitions, retention policies, and measurement methodologies may differ completely across data centers.
This calculation reveals a third critical variable: data temperature. The 18PB represents total retained volume and cannot be equated directly with SSD demand. Recovery frequency, latency targets, and cost per TB determine the warm/cold mix, which also changes as data ages. Total stored volume is first determined by task count, per-task footprint, and retention period; media procurement follows only afterward.
When Memory Fills Up, SSDs Absorb the Data That Can Least Afford to Wait
Once total stored volume is established, the most latency-sensitive data moves first to enterprise SSDs. SSDs are becoming the “warm-data tier” between memory and shared storage: they cost more per unit of capacity than HDDs but offer faster random reads and are better suited to frequent writes, checkpoint recovery, and local caching. When SSDs reduce GPU idle time, customers are effectively paying for both storage capacity and productive compute time.
Cloud providers rarely disclose complete data on per-task footprints, retention periods, or warm/cold ratios. Citi’s inference-context memory storage proposal provides a top-down configuration stress test. The design inserts a high-capacity flash tier between local SSDs and shared enterprise storage to preserve inference context. Its illustrative system comprises 18 compute trays, each equipped with 4 GPUs, for a total of 72 GPUs.
At 16TB of SSD capacity per GPU, each system requires 1,152TB of flash storage. Under Citi’s scenario analysis, 30,000 systems would require 34.56 million TB, equivalent to approximately 2.8% of global NAND demand; 100,000 systems would require 115.2 million TB, or approximately 9.3%. These figures are institutional assumptions, not confirmed purchase orders from Nvidia or cloud providers.
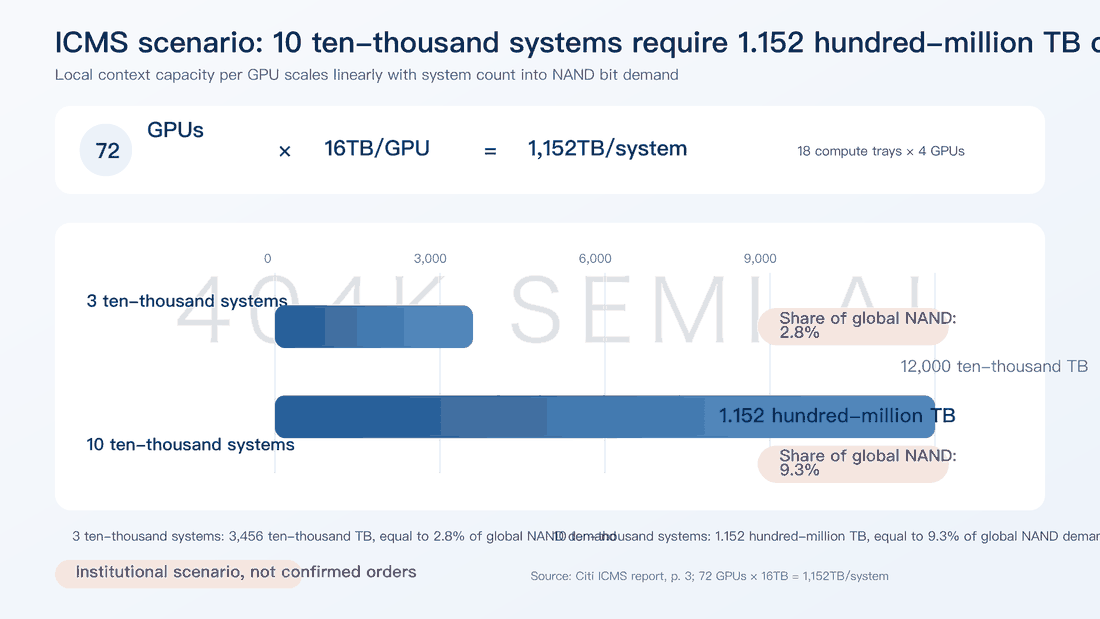
The scenario’s main value is that it translates “longer context” into procurable TB. The preceding task-based calculation derives stored volume from usage, while this configuration-based calculation indicates the potential upper limit of device-side capacity. The gap between them reflects utilization, retention rates, compression ratios, and the speed of migration between hot and cold tiers. Reducing any of these variables would push NAND demand materially below the scenario estimate.
Enterprise SSD vendors must also address a profitability question: which media will deliver the incremental capacity? High-capacity QLC products provide more TB at a lower unit cost, making them suitable for read-intensive, write-light inference caches and content repositories. However, write endurance, latency consistency, and controller capabilities limit their scope; write-intensive logs and frequently rewritten data still require more durable solutions.
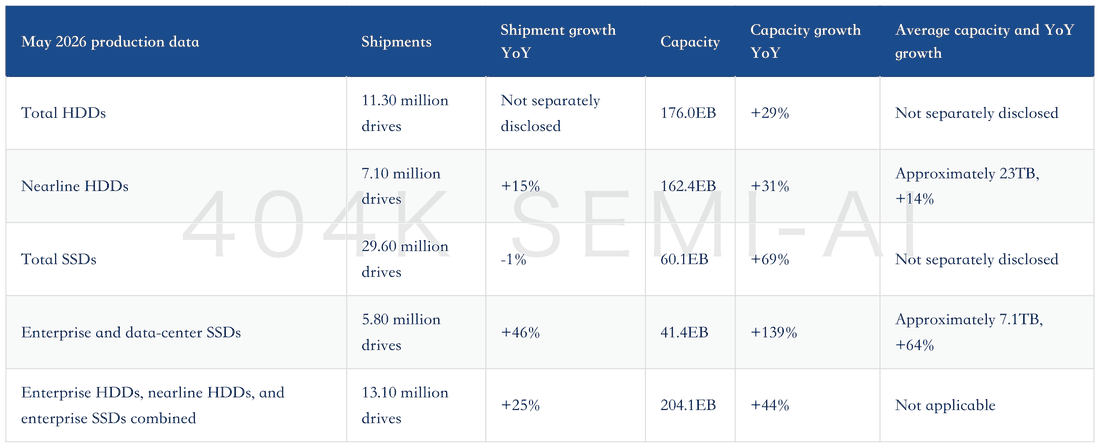
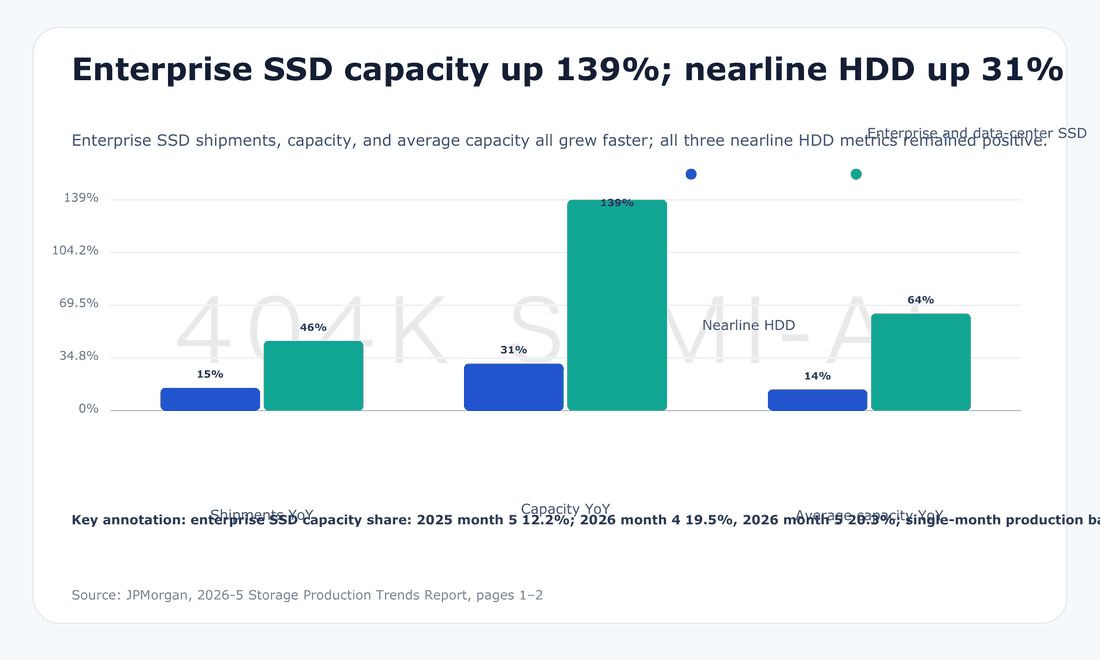
Production data from May 2026 already show vendors packing more capacity into each SSD. Enterprise and data-center SSD production reached 5.8 million drives, up 46% year over year; capacity reached 41.4EB, up 139%; and average capacity was approximately 7.1TB, up 64%. Production of 61.44TB, 122.88TB, and 245.76TB products increased, while 1Tb and 2Tb QLC dies also became more common.
Unit shipments, capacity, and revenue will not grow in lockstep. Capacity is rising far faster than shipments, indicating increasing capacity per drive. Whether vendors can convert capacity growth into profit will depend on the rate of price declines per GB, unit costs following process transitions, yields, product mix, and customer qualification.
SSDs Are Getting Larger, but HDDs Still Carry the Biggest Cold-Data Bill
Once warm data moves onto SSDs, most low-frequency data still needs a cheaper home. Nearline HDDs retain their economic advantage for high-capacity storage. Bernstein estimates that NAND still commands an approximately 23x price premium per unit of capacity over enterprise HDDs. This gap creates a clear boundary for cold data: once access frequency falls sufficiently, customers are willing to accept slower reads in exchange for storing more copies and longer histories at lower cost.
AI data growth will also increase absolute demand for cold storage. Training corpora, model versions, logs, agent trajectories, and synthetic data may be hot when first generated, but much of this content subsequently becomes infrequently accessed. Deletion policies determine how much demand materializes, while regulatory retention, traceability, retraining, and disaster recovery extend retention periods.
HDD capacity growth increasingly depends on capacity per drive. In May 2026, HDD production reached 11.30 million drives with total capacity of 176.0EB, up 29% year over year. Nearline HDD production totaled 7.10 million drives, up 15%; capacity reached 162.4EB, up 31%; and average capacity was approximately 23TB, up 14%.
In the same month, nearline HDD capacity was nearly four times that of enterprise and data-center SSDs. This gap shows that rising SSD penetration will not automatically displace HDDs. Customers allocate performance budgets to SSDs and capacity budgets to HDDs, then use software to determine which data should migrate between tiers.
Pricing is also beginning to affect HDD profitability. Channel checks estimate a nearline HDD shortage of approximately 300EB in 2026, equivalent to 10% to 15% of demand; the shortfall could reach 400EB in both 2027 and 2028. The same checks estimate annual capacity-demand growth of 40% to 50%, versus supply growth of approximately 30% to 35%.
These figures remain channel estimates. Current blended nearline pricing is approximately US$14.3 to US$14.9 per TB, while some spot quotes have reached US$30 to US$35. Manufacturers are targeting a range of US$25 to US$30 for 2027 to 2028. These three data sets use different methodologies and should not be treated as directly comparable industry transaction prices.
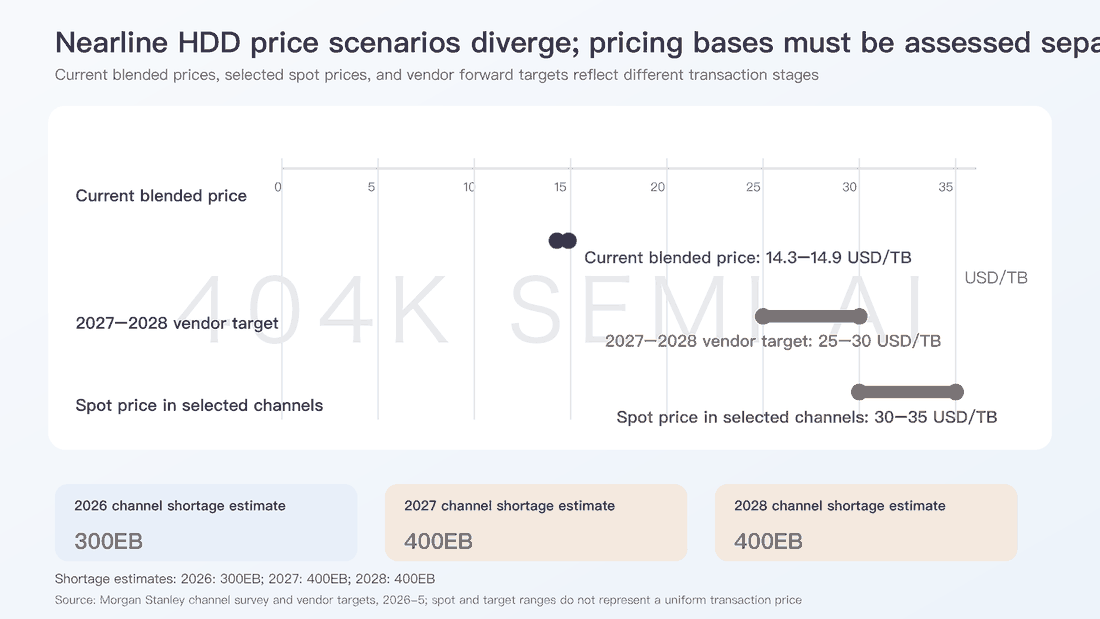
HDD manufacturers’ revenue can be approximated as shipped EB multiplied by price per TB. Higher areal density increases capacity per drive, while technology roadmaps such as HAMR also affect platter, head, and manufacturing costs. If pricing rises faster than unit costs, more incremental revenue should flow through to profit; if technology ramps encounter difficulties, lower yields and higher costs will absorb part of the pricing benefit.
Simultaneous Growth in Both Media Is the Most Important Signal
If task volume, per-task footprint, and retention periods all increase, both hot and cold storage tiers can expand simultaneously. May 2026 data provide early validation: combined shipments of enterprise HDDs, nearline HDDs, and enterprise SSDs reached 13.10 million drives, up 25% year over year, while combined capacity rose 44% to 204.1EB. Customers are purchasing more total capacity; SSDs are capturing a larger share of incremental demand, while absolute HDD capacity continues to grow.
Enterprise SSD capacity is growing faster, while absolute nearline HDD capacity continues to rise
SSDs’ share of enterprise storage capacity increased from 12.2% in May 2025 to 19.5% in April 2026 and 20.3% in May 2026. The one-year shift shows that higher-performance media are growing faster. Monthly production data can be affected by inventory building, product transitions, and supply timing, so subsequent months are needed to confirm whether the trend is durable.
These figures also remind investors to focus less on drive counts and more on EB. Total SSD shipments declined 1% year over year, yet total capacity grew 69%. HDD shipment growth also lagged capacity growth. Manufacturers are delivering more data capacity per drive, making revenue and profit increasingly dependent on price per TB, product mix, and unit costs.
The optimal architecture for cloud providers will not remain static. If SSD prices fall, QLC density improves, or software compression becomes more effective, some warm data can remain on flash for longer. If HDD areal density increases and pricing remains low, the cold tier will retain its economic advantage. The ultimate procurement mix depends on the value of data generated by each useful task, not simply on relative media speed.
Software Compression Will Reshape Tiering but Is Unlikely to Eliminate Aggregate Demand
Software primarily changes per-task footprint, compression ratios, and the hot/cold mix; it does not eliminate every category of data simultaneously. Bernstein’s analysis of Google’s TurboQuant, for example, notes that it compresses the KV cache during inference. Model weights, training data, and static data fall outside its scope. Its direct effect on HDD demand is therefore limited, while its impact on NAND is concentrated in the context-cache layer.
This boundary is critical. Higher KV-cache compression could reduce the flash capacity required per session. Cloud providers could also redeploy the freed capacity toward longer contexts, more concurrent agents, or longer retention periods. This latter “demand refill” remains an unproven hypothesis and requires monitoring both per-task capacity and total task volume.
Software efficiency will also affect procurement timing. If a compression solution requires additional compute, reduces accuracy, or increases time to first token, customers may deploy it only for selected models. The metrics that ultimately affect hardware orders include realized compression ratios, hit rates, latency, output quality, the range of supported models, and whether customers reduce SSD capacity per GPU.
The counterargument for HDDs comes from another direction. If NAND unit costs continue to fall rapidly and high-capacity QLC develops stronger advantages in energy consumption, rack space, and operations, the boundary for cold data will shift toward SSDs. The current approximately 23x price gap per unit of capacity provides a buffer, but does not guarantee that the gap will persist.
How Storage Demand Flows into Revenue, Profit, and Cash Flow
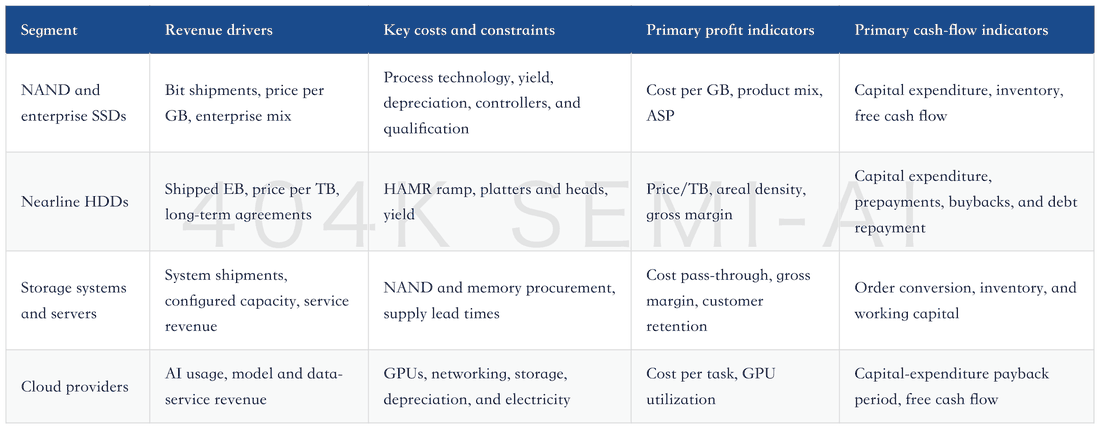
The task ledger creates the installed data stock; the hot/cold mix determines media procurement; and suppliers ultimately recognize revenue through volume, pricing, and product mix. The two shortest revenue bridges are:
Change in enterprise SSD revenue ≈ change in shipped bits × change in price per GB × product-mix effect
Change in nearline HDD revenue ≈ change in shipped EB × change in price per TB
NAND manufacturers first see bit demand and product mix. A higher enterprise SSD mix typically increases the value contributed by high-capacity NAND, controllers, and firmware. Gross margin must still absorb process migrations, yield, depreciation, and customer-qualification costs; capacity growth does not automatically translate into profit growth.
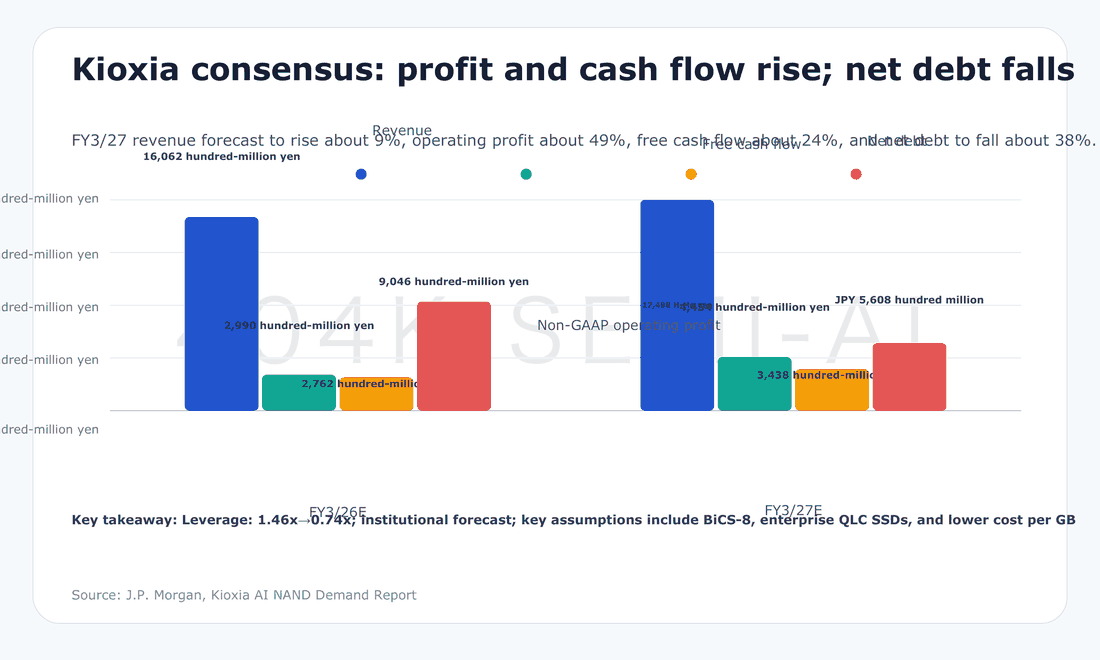
J.P. Morgan’s forecasts for Kioxia provide one example of this financial transmission. Its model projects FY3/26 revenue of JPY1.6062 trillion and non-GAAP operating profit of JPY299.0 billion. For FY3/27, it forecasts revenue of JPY1.7498 trillion and operating profit of JPY445.4 billion. The principal assumptions are the BiCS-8 ramp, QLC enterprise SSD growth, and lower cost per GB.
Profit growth must also convert into cash. The model forecasts Kioxia’s free cash flow rising from JPY276.2 billion in FY3/26 to JPY343.8 billion in FY3/27, while net debt declines from JPY904.6 billion to JPY560.8 billion and leverage falls from 1.46x to 0.74x. Whether these forecasts are realized depends on NAND pricing, bit shipments, capital expenditure, and yields moving favorably together.
HDD manufacturers’ profit sensitivity is more concentrated in shipped EB, price per TB, and areal density. Bernstein estimates 2025 industry shares of 45% for Western Digital, 42% for Seagate Technology, and 13% for Toshiba. With the two largest suppliers controlling most of the market, capacity discipline and long-term agreements directly affect pricing, although cuts to cloud capital expenditure would still flow quickly into orders.
Systems vendors face a different set of pressures. Citi’s North American hardware research argues that agentic workloads will increase demand for general-purpose servers and enterprise data processing, while higher NAND and memory prices will compress storage-hardware gross margins. Full-stack vendors that sell servers, networking, storage, and services are better positioned to pass through costs across an integrated solution.
Pure-play all-flash vendors may see revenue rise with capacity demand, but their procurement costs will increase simultaneously. Raising prices too quickly could delay customer deployments or even cause customer attrition. When assessing systems vendors, investors should evaluate order growth, component costs, and gross margins together; revenue alone can overstate earnings leverage.
Cloud providers must also divide the hardware bill by the number of useful tasks completed. If storage capacity grows faster than successfully completed tasks, depreciation and capital employed per task will rise. If caching and data reuse improve GPU utilization, the same storage investment can support more revenue. For this demand cycle to be sustainable, supplier shipment growth and customer returns on capital must both hold.
Different operating variables drive revenue, profit, and cash flow across the storage value chain
The Three Scenarios Hinge on Whether Task Growth Outpaces Efficiency Gains
AI storage demand is governed by five variables: the number of effective tasks, data footprint per task, retention period, replication, and compression/deduplication. The first three expand raw data volumes, replication raises the cost of reliability, and compression and deletion reduce effective capacity requirements. The hot/cold data mix then determines how much demand is served by SSDs versus HDDs. Long contexts, concurrent agents, and compliance-driven retention increase the numerator, while software efficiency reduces the per-task footprint.
The balance between task growth and efficiency gains determines the storage-demand scenario
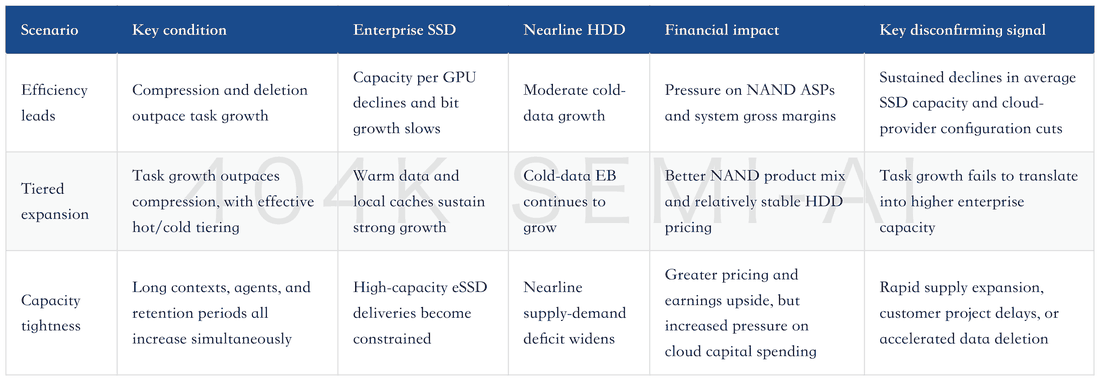
The base case is closest to “tiered expansion.” Supporting evidence includes 139% year-over-year growth in enterprise SSD capacity, 31% growth in nearline HDD capacity, and a rising SSD share of total capacity. This assessment still rests on one month of production data and forecasts from multiple institutions; its durability must be confirmed by quarterly shipments, pricing, and cloud capital spending.
The capacity-tightness scenario is most favorable for supplier profits, but not necessarily for customers. Higher storage prices increase the full-lifecycle cost of each AI task. Customers may respond by shortening retention periods, compressing data, delaying deployments, or renegotiating configurations, creating a self-correcting demand response.
How to Read the Public Data over the Next Four Quarters
The first group of metrics comes from the workload side: completed effective tasks, retainable data per task, and average retention periods. Cloud providers may not disclose these three metrics directly, but investors can track inference-call volumes, agent steps, log and index sizes, storage capacity per GPU, and data-retention policies. Rising call volumes alongside lower per-machine storage configurations would indicate that efficiency is absorbing demand. A steeper capacity curve requires tasks, configurations, and retention periods to rise together.
The second group covers enterprise SSD “units, TB, and economics.” Unit shipments indicate customer breadth and deployment pace, average capacity shows per-machine configuration, and price per GB reflects revenue quality. All three must increase together to demonstrate that AI demand is driving both volume and pricing.
The third group is nearline HDD EB and price per TB. EB growth confirms that cold data is translating into procurement, while higher pricing indicates that supply discipline or shortages are beginning to support profits. Long-term agreements, spot quotations, and vendor targets must be assessed separately to avoid treating small-sample quotes as industry-wide realized pricing.
The fourth group tracks migration between storage media. A continued increase in enterprise SSD capacity share alongside sustained growth in absolute nearline HDD EB would indicate that hot/cold tiering is still expanding. Weakening HDD EB combined with accelerating SSD capacity would look more like media substitution; simultaneous weakness in both could signal slower cloud capital spending or data generation.
The fifth group measures customer economics. Cloud providers should disclose, or indirectly reveal, GPU utilization, inference-call volumes, average context length, storage configurations, and AI revenue. Hardware vendors, meanwhile, must demonstrate through gross margins, inventory, capital spending, and free cash flow that capacity growth is generating adequate returns.
Software efficiency should be accounted for separately. If better compression reduces SSD capacity per GPU, the efficiency gains accrue to customer costs. If configurations remain unchanged while concurrency, context length, or retention periods increase, those gains are converted into additional workloads. The implications for storage vendors differ materially between these outcomes.
Storage Ultimately Has to Satisfy Two Economic Tests
The first is for AI customers: how many valuable tasks can each incremental unit of storage support? Enterprise SSDs justify their cost when data reuse reduces duplicated computation, improves GPU utilization, or shortens recovery times. When data is rarely accessed again, nearline HDDs preserve optionality at a lower cost per TB.
The second is for suppliers: how much cash does capacity growth generate? NAND producers must create a positive spread between bit growth, unit costs, and capital spending; HDD vendors must ensure that EB, price per TB, and areal density offset the cost of technology ramps; and system vendors must demonstrate that costs can be passed through to customers.
Current evidence supports simultaneous expansion in SSDs and HDDs. Enterprise SSDs serve hotter, more latency-sensitive data, while nearline HDDs retain colder, larger, and longer-lived datasets. This thesis will be tested against four categories of metrics: data footprint and retention period per effective task; average enterprise SSD capacity and unit pricing; nearline HDD shipment EB and price/TB; and cloud providers’ full cost per effective AI task.