
目录
I. Similar Bottlenecks, Different Earnings Clocks
II. The Key Driver of Compute Demand Is Shifting from Training Budgets to Sustained Usage
III. Compute-Chain Profits Are Being Reallocated Around Capacity and Complexity
IV. The Memory Inflection Point Will Show Up First in the Pace of Price Increases
V. HBM Complexity Could Delay Supply Normalization
VI. Incremental Networking Demand Begins with Expanding Connectivity at Scale
VII. Equipment and Analog: Distinct Earnings Drivers
VIII. Translating Industry Growth into Reproducible Profit Estimates
IX. Three Time Windows for Future Validation
本内容基于公开资料和研报数据整理,不构成任何投资建议,不代表任何个人观点,仅供学习参考,请理性阅读
AI investment is entering a more selective phase. Demand continues to expand, but profit cycles are diverging across the supply chain. Compute depends on execution and delivery, memory on the durability of price increases, and networking on connection scale and technology choices. The critical questions are how long shortages can persist and where the resulting profits will ultimately accrue.
I. Similar Bottlenecks, Different Earnings Clocks
The industry assessments and institutional forecasts in this report are based on information available as of September 8, 2026. Forecasts for future market size, growth, and product-adoption timelines remain subject to verification.
An AI server supply chain can exhibit three trends simultaneously: rising accelerator orders, elevated memory prices, and a new expansion cycle in networking equipment. All three can support industry revenue growth, but they do not necessarily produce the same equity returns. Delivery volumes, unit economics, and the growth already priced into valuations each follow a different trajectory.
Morgan Stanley currently ranks AI compute as its highest-conviction theme, followed by networking, while adopting a more selective, late-cycle view of memory. The analytical value of this ranking is that it moves beyond whether demand is strong to more specific questions: In which direction will earnings estimates be revised, and will the next round of capital spending generate incremental revenue or future competitive supply?
A bottleneck begins as a physical constraint. Wafer capacity, packaging capability, substrate area, and communication distance can all limit system deliveries. But converting a physical constraint into corporate profits requires suppliers to have qualified capacity, obtain customer certification, secure contracts that allow rational pricing, and achieve yields sufficient to cover costs. Repeated references to a shortage make a segment worth investigating; they do not prove that every company in it can earn sustained excess returns.
Timing comes next. A materials segment requiring two years to expand capacity may enjoy a longer pricing window, while shortages can ease more quickly where supply can be unlocked through process migration or product-mix adjustments. Capital markets also anticipate these changes. When suppliers are reporting record profits, investors may already be pricing in the next capacity wave; while customers are still pushing for lower prices, the market may begin trading an inventory bottom.
Analyzing AI bottlenecks therefore requires linking three sets of accounts. The first is demand: whether end-user consumption is rising and how much customers will pay for compute. The second is supply: when new capacity will qualify and how many wafers, tools, and materials each unit of output requires. The third is profit: how pricing, product mix, depreciation, and working capital convert orders into cash returns. Timing gaps among these three accounts are driving the current industry divergence.
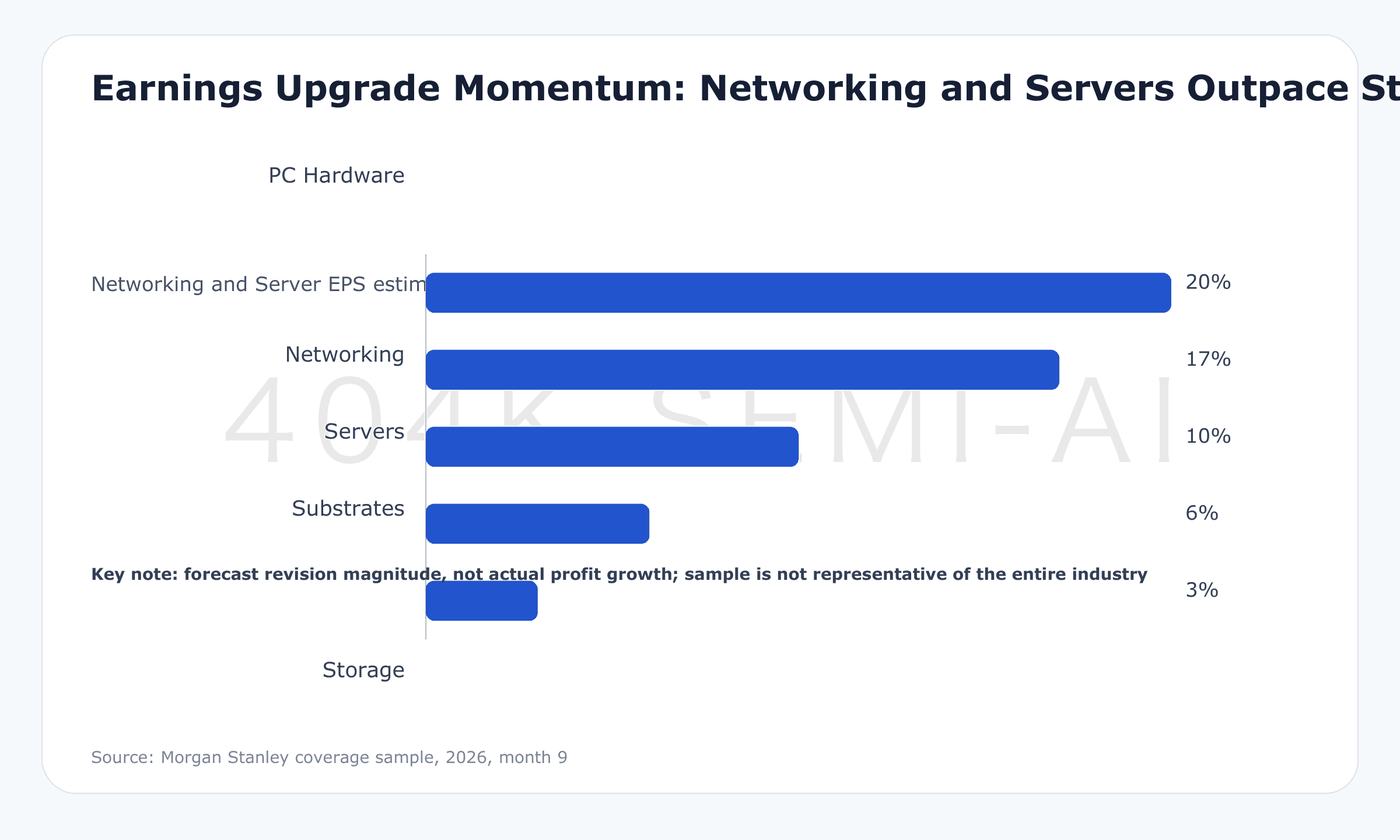
That divergence is already visible in earnings revisions. Across Morgan Stanley’s coverage universe, EPS estimates over the past month have risen by approximately 17% for networking, 10% for servers, and 3% for memory. These figures measure estimate revisions, and the sample does not represent the entire industry; they should not be treated as actual earnings growth. They nevertheless signal a meaningful shift: the segments with the strongest cumulative cycle may no longer be those receiving the fastest incremental upgrades.
II. The Key Driver of Compute Demand Is Shifting from Training Budgets to Sustained Usage
The central hardware-demand assumption behind the latest improvement in model capabilities is that inference will evolve from occasional queries into continuous execution. Longer task chains, more tool calls, and more frequent validation and retries all increase the compute required to complete a task. The user sees only one result, but the backend may perform multiple rounds of model inference, data retrieval, and task scheduling.
A more useful framework for hardware demand is: total inference compute demand approximately equals the number of active tasks multiplied by the number of inference runs per task and by the resources consumed per inference run. All three variables may rise simultaneously, or they may offset one another. Better models expand the range of addressable tasks, while software optimization can reduce per-task costs. Infrastructure expansion has an economic foundation only if the net effect remains positive.
This also explains why the compute opportunity extends beyond GPUs to CPUs, custom chips, advanced logic manufacturing, and supporting components. Task execution involves data preparation, state management, and tool orchestration, so the full workload does not reside on a single type of chip. Different workloads require different hardware configurations. The supply chain benefits from the incremental complexity of the overall system, not from a mechanical replication of one component.
However, the premise that each task consumes more compute still requires one commercial condition: the additional compute must create sufficient user value. Whether enterprises expand paid usage, whether higher task-success rates reduce human intervention, and whether revenue growth covers depreciation, electricity, and networking expenses will determine the sustainability of demand. If systems do more work without materially improving monetizable output, capital spending will ultimately face return constraints.
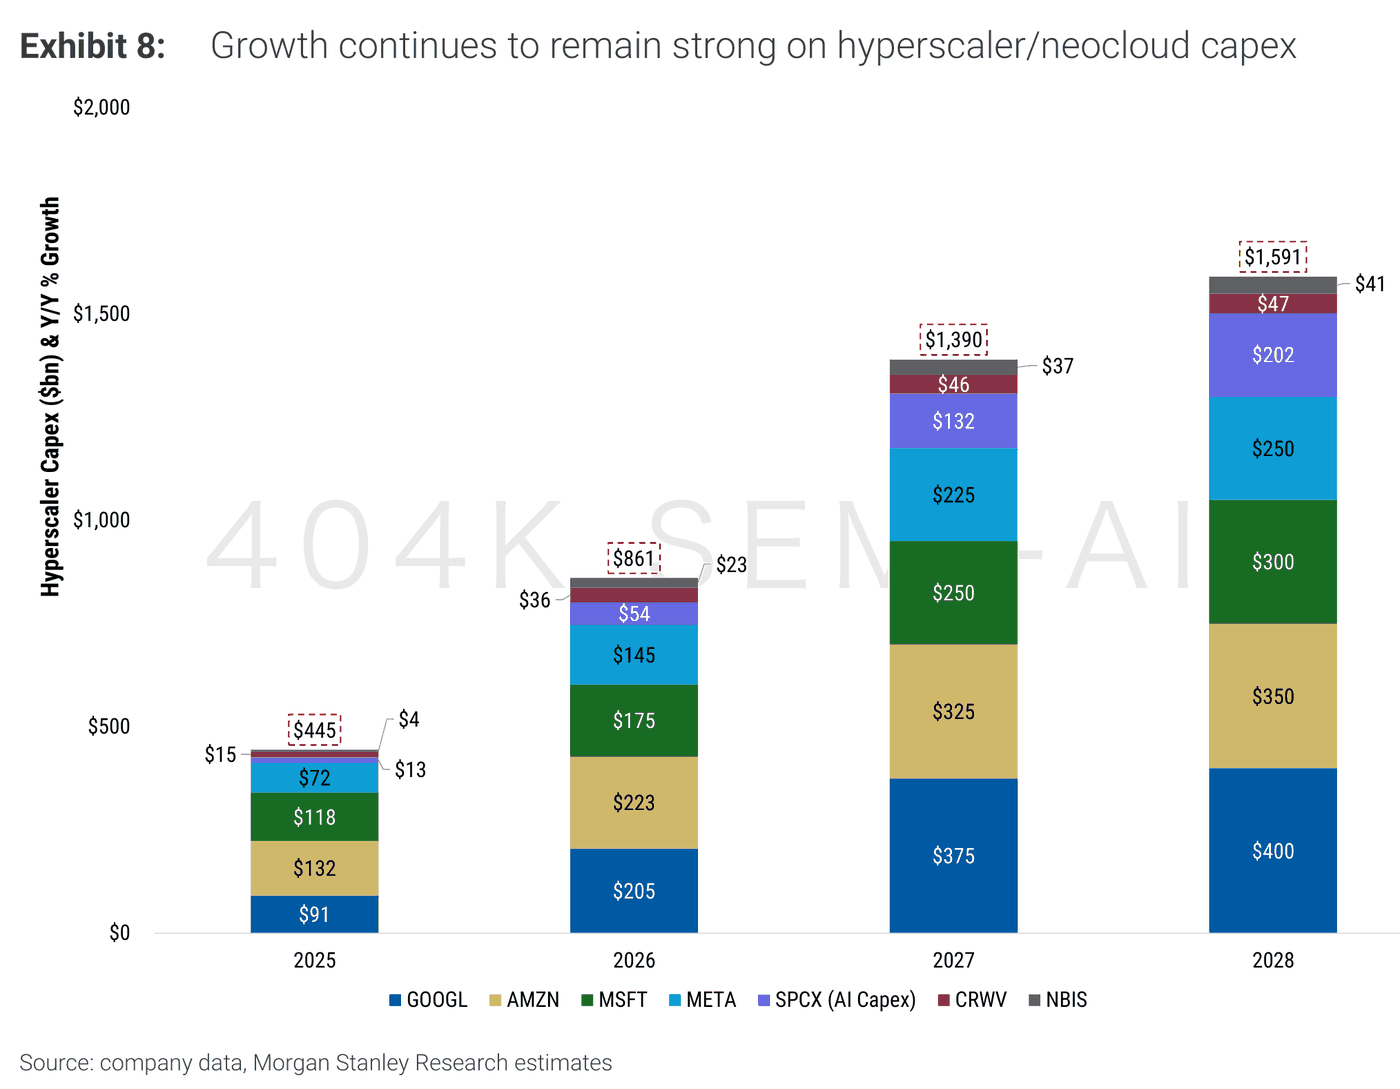
Cloud capex should therefore be assessed in terms of both absolute spending and growth. Morgan Stanley estimates that major hyperscalers and neocloud companies spent US$445 billion in 2025, with forecasts of US$861 billion, US$1.390 trillion, and US$1.591 trillion for 2026, 2027, and 2028, respectively. These figures combine company disclosures and institutional estimates; the later years are forecasts, and corporate capex covers a broader range of assets than AI chip purchases alone.
Based on this series, annual growth is approximately 93%, 61%, and 14%. Spending continues to rise, but the growth rate slows sharply. 2028 may still be a year of enormous investment, but if the supply chain has expanded capacity based on earlier, faster growth rates, utilization will need to be tested. For highly valued companies, slower growth can also reduce the earnings multiples investors are willing to assign.
The sequence through which investment converts into revenue also matters. Land acquisition, power connections, facility construction, and equipment procurement do not necessarily occur in parallel, and chip delivery does not mean a data center is already providing effective service capacity. Higher customer capex is an important signal for supply-chain demand, but supplier revenue must still pass through order allocation, qualification, delivery, and acceptance. The most valuable analytical distinction is between companies that have already cleared these hurdles and those still positioned only in long-range capacity plans.
III. Compute-Chain Profits Are Being Reallocated Around Capacity and Complexity
Advanced manufacturing holds a distinctive position in the compute supply chain. Customers can adjust chip architectures and supplier mixes, but high-performance chips still require the corresponding process technologies and manufacturing capacity. If demand continues to exceed expectations, foundry and packaging companies capable of delivering qualified capacity on schedule will occupy a critical position in converting orders into revenue.
Morgan Stanley believes it is reasonable for TSMC’s AI semiconductor business to sustain compound growth of 70%–80% and expects it to account for more than 30% of revenue in 2026. This institutional growth assessment should be distinguished from the company’s actual revenue and profit. A rising contribution from a high-growth business can improve the revenue mix, but overall profitability will still depend on process mix, utilization, depreciation, and the cost of new fabs.
A simplified example illustrates the effect of revenue mix. If a business accounts for 30% of corporate revenue, grows 70%, and all other revenue remains unchanged, it contributes approximately 21 percentage points to total revenue growth. This calculation only demonstrates the relationship between weighting and growth; it is not a forecast for TSMC. Actual results will also depend on the remaining businesses, classification methodology, and base period. The point is that once an AI business reaches sufficient scale, it can materially raise the growth profile of a large company.
