
目录
Contents
I. After the Boom, What Kind of Growth Will the Market Pay For?
II. The Level and Growth Rate of Capital Spending Tell Different Stories
III. Compute Opportunities Are Broadening, but Content Value Matters More Than Company Lists
IV. The Key Debate in Memory: How Long Can Prices Keep Rising?
V. HBM4E Manufacturing Complexity Could Prolong the Memory Shortage
VI. Equipment and Packaging-and-Testing Upside Depends on Where Investment Is Deployed
VII. Value the Network TAM Separately from the Copper-to-Optics Timeline
VIII. Analog Semiconductors and Consumer Electronics Offer a Separate Cyclical Check
IX. Translate Bottlenecks into Earnings—and Test Them Against Cash Flow
10. The Next Wave of Opportunity Depends on Which Variable Is Validated First
本内容基于公开资料和研报数据整理,不构成任何投资建议,不代表任何个人观点,仅供学习参考,请理性阅读
AI demand remains robust, but the tightest bottleneck may not offer the greatest upside to earnings estimates. The next re-rating will depend on when supply comes online, whether value per unit can rise, and how fully the market has already priced in incremental profits.
Contents
I. After the Boom, What Kind of Growth Will the Market Pay For?
II. The Level and Growth Rate of Capital Spending Tell Different Stories
III. Compute Opportunities Are Broadening, but Content Value Matters More Than Company Lists
IV. The Key Debate in Memory Is How Long Prices Can Keep Rising
V. HBM4E Manufacturing Challenges Could Prolong the Memory Shortage
VI. Returns for Equipment and Packaging-and-Testing Suppliers Depend on Where Investment Is Directed
VII. Networking TAM and the Copper-to-Optical Timeline Require Separate Valuations
VIII. Analog Chips and Consumer Electronics Offer Additional Cyclical Confirmation
IX. Translating Bottlenecks into Earnings Still Requires a Cash-Flow Test
X. The Next Opportunity Depends on Which Variable Is Validated First
I. After the Boom, What Kind of Growth Will the Market Pay For?
Morgan Stanley’s September 7, 2026 report, Which AI Bottleneck Should You Invest In?, appears to rank opportunities across the global technology supply chain. Its deeper question is how research frameworks must evolve once growth expectations are already elevated. The report remains bullish on AI compute, ranks networking second, stays selective on memory, and views analog semiconductors as an early-cycle diversifier. The critical issue is not which industry is hottest, but how much further operating performance can improve beyond current forecasts.
This requires separating three questions that are often conflated: Is demand growing? Are corporate profits growing? Can the stock still generate excess returns? Continued purchasing by large customers supports the first conclusion. The second requires suppliers to convert orders into deliveries, customer acceptance, absorbed costs, and cash collection. The third requires earnings to exceed what the market has already priced in. The three are related, but they are not interchangeable.
The original report provides a striking comparison. Using September 4, 2025 as the base date, the index of consensus FY2027 memory EPS estimates has risen by a cumulative 1215%, versus 134%, 102%, and 34% for networking, AI compute, and non-AI sectors, respectively. The 1215% figure measures the increase in estimates for the same future fiscal year; it emphatically does not mean that memory-sector profits will grow 1215% year over year in 2027. Its real value is that it shows how much good news the market has already absorbed.
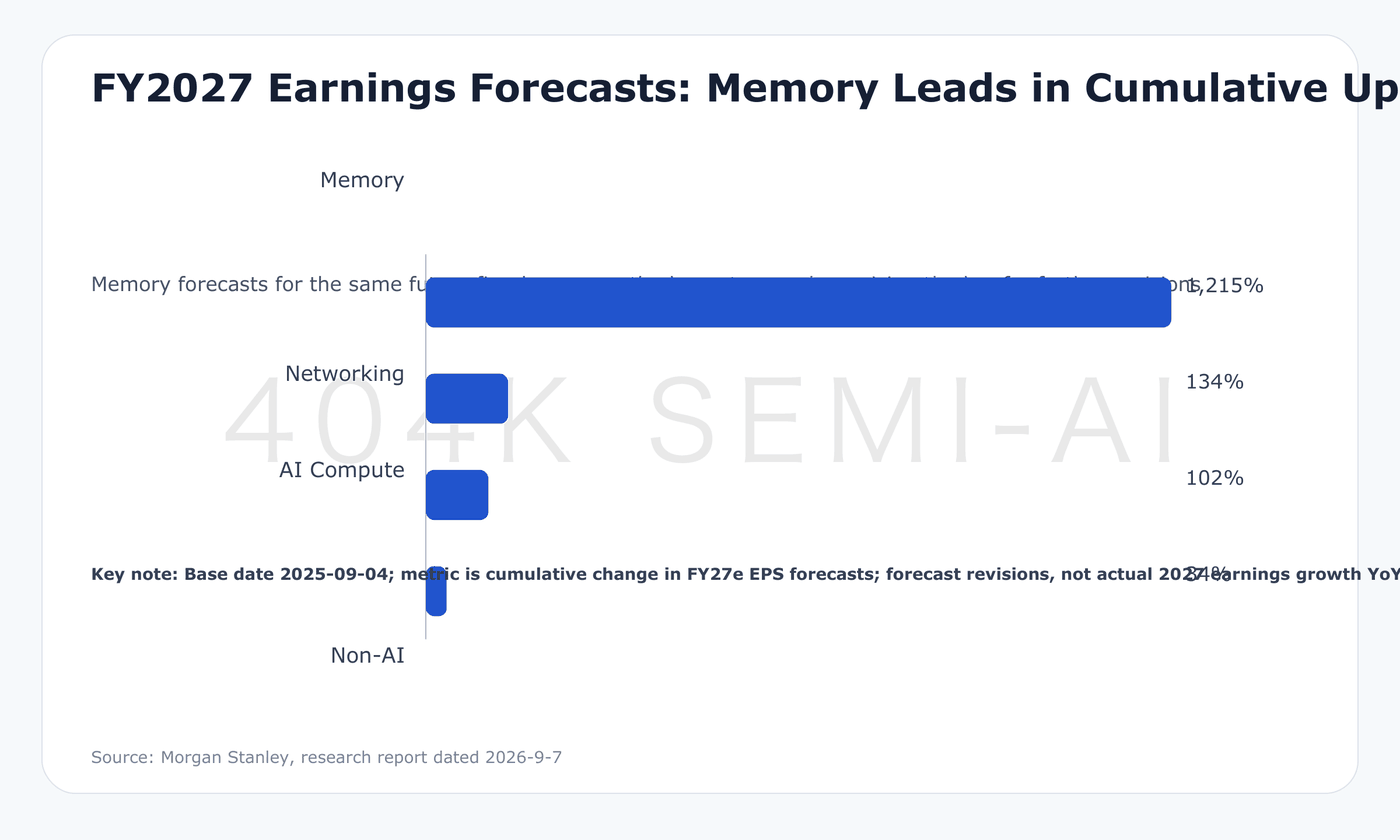
The exceptionally large upgrade to memory estimates may reflect a low base, price recovery, and operating leverage, but it also raises the hurdle for the next earnings release. Even strong results may not trigger another re-rating if they merely meet consensus. The report also finds that incremental earnings-revision momentum has begun to diverge: compute, networking, and selected non-AI segments remain relatively strong, while memory’s relative momentum has weakened. This explains the coexistence of strong earnings and weak share-price performance better than a static P/E table can.
Profit expectations impose another constraint. Consensus expects AI beneficiaries to deliver 56% earnings growth in 2027, while Morgan Stanley considers 53% more realistic. The three-percentage-point gap does not determine the sector outlook by itself, but it highlights the firm’s concern: consensus still assumes further margin expansion even as revenue growth slows. For businesses with high fixed costs, heavy capacity investment, and rapid product cycles, the link between revenue and profit requires more evidence than simply extending an upward trend line.
The proper starting point, therefore, is to reassess the conditions under which profits are created. Supply shortages may enable price increases, but they may also disrupt deliveries. Greater technical complexity may raise a supplier’s value, but it can initially depress yields. Order growth may increase revenue, but it can also consume more working capital through inventories and receivables. The bottlenecks most deserving of deeper research are those that connect sustained customer spending, stable competitive dynamics, and improving returns on capital.
II. The Level and Growth Rate of Capital Spending Tell Different Stories
The report views advances in next-generation AI model capabilities as a demand catalyst. The economic logic is that if each dollar can perform more useful tasks, enterprises may assign more work to AI, increasing the number, duration, and complexity of inference workloads. This is a demand-elasticity hypothesis. Whether it holds ultimately depends on task quality, real-world usage frequency, and customers’ willingness to pay—not on a one-off capability demonstration.
There are at least two conversion steps between an application breakthrough and hardware spending. First, capability must become sustained usage: a feature that performs well in a demonstration must also work reliably in real-world workflows. Second, usage must generate economic returns: incremental revenue, cost savings, or shorter delivery times must be sufficient to cover inference and operating expenses. Only when both conversions persist will cloud infrastructure expansion rest on firmer demand foundations.
Morgan Stanley estimates that aggregate capital expenditure by cloud providers and neoclouds will reach $445 billion, $861 billion, $1.390 trillion, and $1.591 trillion from 2025 through 2028, respectively. Figures for 2026 and beyond were estimates as of the report date. Based on these values, year-over-year growth in 2026, 2027, and 2028 would be approximately 93.5%, 61.4%, and 14.5%. These projections reveal two sides of the same trajectory: spending continues to rise in absolute terms, but its growth rate steadily decelerates.
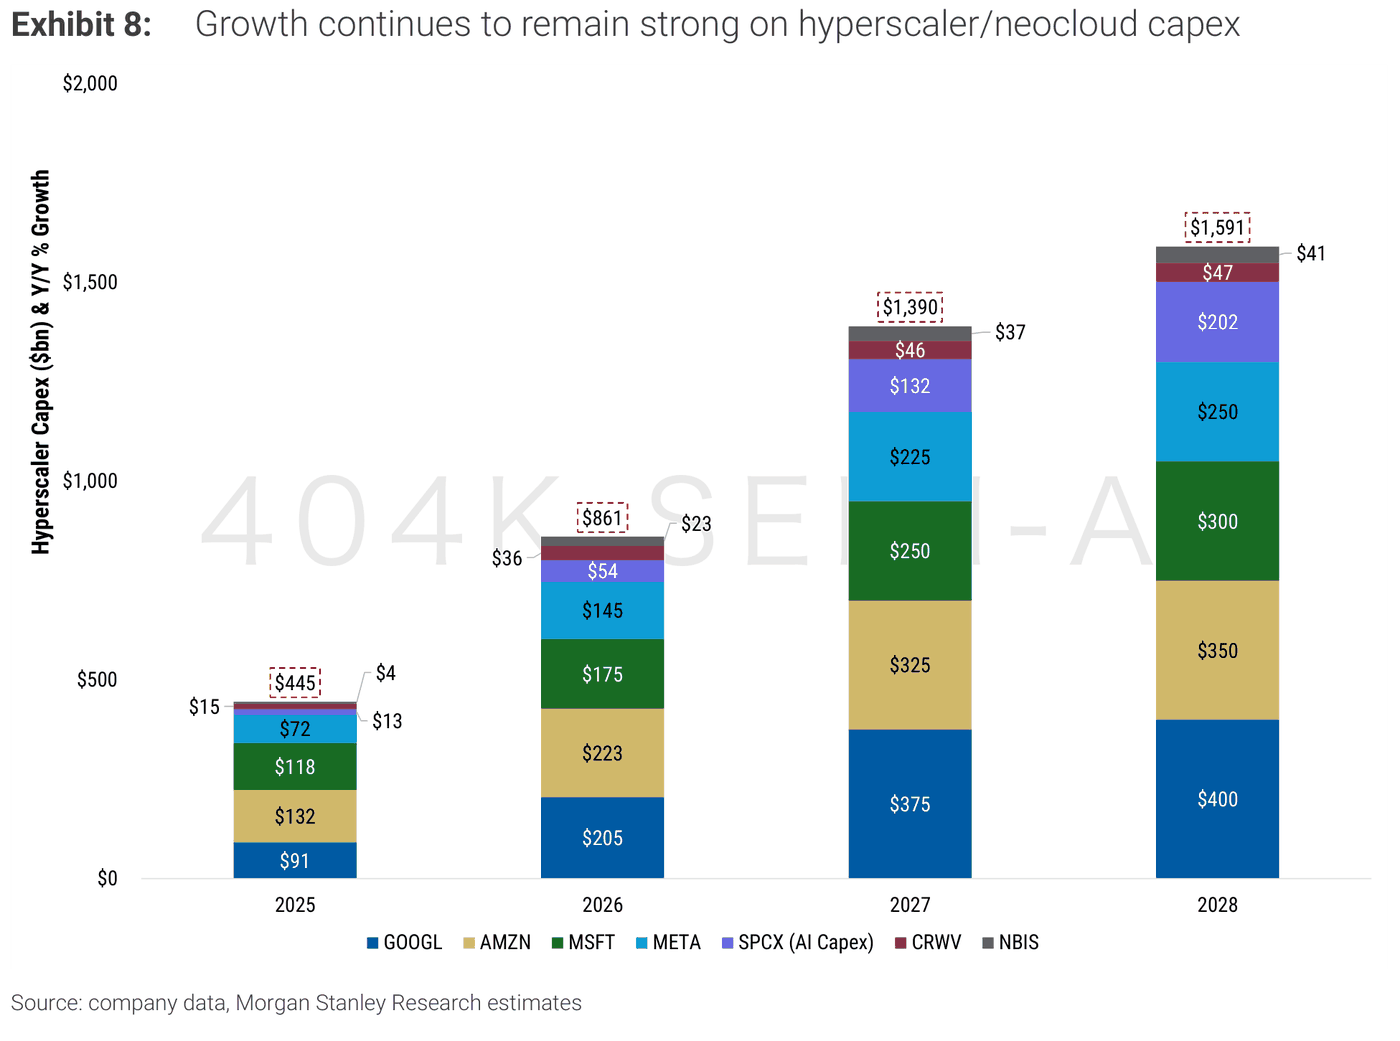
For suppliers, a larger absolute spending pool should support order levels, but it may not sustain the same pace of incremental order growth seen in the previous phase. If customers previously placed advance orders to guard against shortages, procurement trends may also lag changes in capital-expenditure budgets. For equipment vendors, the key variables are order conversion and delivery schedules; for component suppliers, they are customer inventories and actual consumption. Treating total cloud-provider budgets as a direct proxy for any individual supplier’s future revenue overlooks both distinctions.
Capital expenditure is not a uniformly distributed pool of funding. Data centers, power infrastructure, servers, networking equipment, and related facilities all have different construction cycles. Spending growth may flow primarily into civil works and power systems during one period, then shift toward accelerators and switches in another. Even if the total forecast remains unchanged, the sequence in which suppliers recognize revenue can vary. Industry analysis must identify where budgets are being deployed and when they become customer-acceptable assets, rather than merely tracking record aggregate spending.
Capital expenditure is also a customer cash outflow but only potential revenue for suppliers, so the risk profiles differ. The more customers invest, the greater their required utilization and return on investment. If application revenue slows, customers may moderate subsequent spending by extending equipment lives, improving model efficiency, or changing system architectures. Such measures would not necessarily invalidate AI demand, but they could reduce the amount of hardware required per unit of demand.
This explains the report’s preference for segments benefiting from higher content per system and greater manufacturing complexity. Such businesses can potentially gain from both equipment volumes and rising value per unit, partly offsetting slower aggregate growth. Each advantage must still be validated individually: lower-cost customer architectures or new designs that eliminate certain components could also reduce content per system. The technology roadmap itself is part of the earnings model.
III. Compute Opportunities Are Broadening, but Content Value Matters More Than Company Lists
Compute remains Morgan Stanley’s preferred exposure, but the report’s analysis extends beyond GPUs. Foundries, custom chips, ABF substrates, multilayer ceramic capacitors, advanced packaging and testing, and power systems collectively provide the physical infrastructure required to operate the chips. An individual component may represent only a small share of total system cost, yet when supply is constrained, it can delay delivery of the entire system—fundamentally changing its commercial importance.
The case for ABF substrates is particularly clear. They provide interconnects in high-performance chip packages, while demand is shifting from traditional PCs toward servers, GPUs, custom chips, and networking. More complex package designs require greater substrate area, more layers, tighter process precision, and longer production time. Even if chip volumes do not rise proportionally, consumption of qualified substrate capacity may still increase. In assessing supply and demand, nominal capacity by area is not a complete substitute for high-end capacity capable of reliable delivery.
