
Contents
Contents
Demand Forecasts Are Sharply Revised Up, but Growth Rates Need Recalculation
Supply Bottlenecks Determine Who Can Turn Demand into Revenue
Shorter Product Cycles Make Delivery Capability the Leader’s Edge
CPO Changes Both Connectivity and Value Allocation
Why Test Equipment May Ramp Before End Systems
Rising Channel Counts and Laser Power Create New Manufacturing Challenges
Far-Out Valuations Are Most Vulnerable to Profit and Timing Slipping Together
Growth Across Segments Requires Different Profit Validation
What to Track Next
This content is compiled from publicly available information and research reports. It does not constitute investment advice or represent any individual's views. For educational reference only; please read critically.
AI expansion is lifting optical interconnect demand, but shipment growth, technology upgrades, and corporate profits will not move in sync. Whether key components can be kitted, whether testing can keep pace with mass production, and where CPO shifts value will determine who can sustainably make money in this cycle.
Contents
Demand forecasts are sharply revised up, but growth rates need recalculation
Supply bottlenecks determine who can turn demand into revenue
Shorter product cycles make delivery capability the leader’s edge
CPO changes both connectivity and value allocation
Why test equipment may ramp before end systems
Rising channel counts and laser power create new manufacturing challenges
Far-out valuations are most vulnerable to profit and timing slipping together
What to track next
Demand Forecasts Are Sharply Revised Up, but Growth Rates Need Recalculation
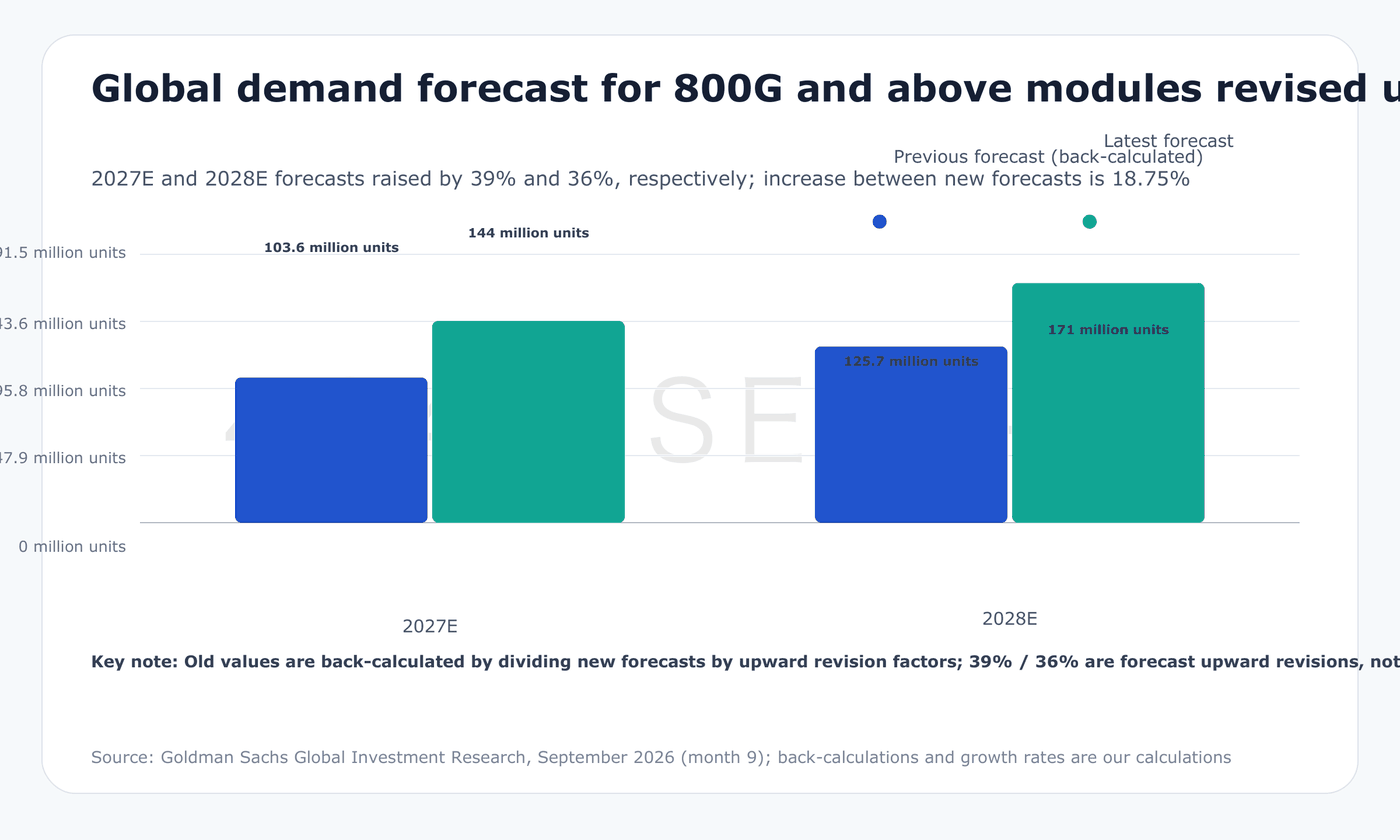
Expectations for high-speed optical modules have been revised higher again. In its September 2026 supply-chain research, Goldman Sachs raised its 2027 and 2028 global demand forecasts for 800G-and-above optical modules to 144 million and 171 million units, respectively—39% and 36% above prior estimates. These numbers show that the old demand model underestimated market size; they do not mean demand will grow 39% and 36% year over year in the next two years.
On the revised forecasts, 2028 volume rises 18.75% over 2027. Dividing the new forecasts by the upgrade factors implies prior forecasts of about 103.6 million and 125.7 million units for those two years. The change mainly reflects an upward shift in the entire demand curve, not proof that growth rates will accelerate annually. This distinction matters for investment judgment: a larger market helps expand the revenue base, while sustained acceleration usually requires stronger order and valuation evidence.
Surveyed companies are more optimistic, suggesting global 800G and 1.6T demand could reach 130 million to 200 million units. Because the interview range does not specify a single year, it cannot be directly compared with a given annual forecast to calculate a gap. The China market description of more than 50 million units also includes 400G; it overlaps with the global scope and covers a different speed range, so the two cannot be added to create a new global total.
The industrial basis for the demand upgrade is AI rack growth and expanding connectivity scope occurring simultaneously. Applications in focus have expanded from lateral connections between systems to tighter connections within compute systems and broader interconnect. As more tasks require multiple compute units, interconnect capability affects whether expensive compute can be fully utilized. But how the connectivity architecture is designed and which distances use optical links still determine how many modules a system ultimately needs.
Optical module demand therefore cannot be calculated as a fixed multiple of GPU count. Goldman did not provide an underlying model sufficient to reconstruct all rack and port configurations; 144 million and 171 million should be treated as institutional forecasts awaiting order validation. The useful change is that a larger demand scale is emerging alongside higher product speeds, shifting suppliers’ task from capacity expansion to completing product transitions on schedule.
Supply Bottlenecks Determine Who Can Turn Demand into Revenue
Strong demand does not mean module makers can ship as much as they want. Surveyed companies also noted that DSP, lasers, and PCBs may still constrain 2027 shipments. Optical modules require multiple components to work together; if one key part is unavailable, the others cannot independently form a sellable finished product.
Dongshan Precision’s 200G EML progress illustrates this. EML combines a laser with modulation; the company says it is in mass production, but current scale remains constrained by DSP supply. Its claim of securing 10 million DSP units for 2027 helps explain inventory preparation, but cannot be directly converted into 10 million 1.6T optical module orders. Specific chip configurations, customer qualifications, and module mix are not clear, leaving a gap between procurement security and eventual revenue.
Such bottlenecks create mismatches in revenue recognition. Suppliers may pay for materials, build inventory, and add staff first, while final delivery waits for complete kits and acceptance. Even with abundant demand, companies may temporarily show higher inventory and prepayments rather than matching improvement in operating cash flow. Investors should read order growth alongside inventory turnover and delivery cycles; looking only at capacity or order value can overstate near-term earnings elasticity.
Upstream supply is not entirely stagnant. LandMark Optoelectronics sees indium phosphide (InP) substrate supply improving, plans to increase MOCVD tools from 62 to 69 by Q2 2027, and is preparing to build a new site in 2027. MOCVD is used for epitaxial material growth and is important production equipment in the laser supply chain. By tool count, 62 to 69 is a roughly 11.3% increase, but this ratio cannot directly represent effective capacity or revenue growth; product mix, operating efficiency, and yield all change the final result.
Supply improvement cuts both ways. It can allow module makers to complete previously undeliverable orders and unlock sales; once shortages ease, it may also reduce upstream pricing power and push prices lower. Surveyed companies expect 800G module prices to decline by a single-digit percentage in 2027, while 1.6T prices remain above $700. These are expectations, not uniform industry transaction prices, and certainly do not guarantee every company’s margin.
What follows is more likely tiered competition: companies able to secure high-spec components, pass customer qualification, and deliver reliably will convert industry demand into revenue first; those with only nominal capacity and no stable component support may lead in capex but lag in delivery. The investment implication of supply bottlenecks is not just price increases, but who customers are willing to award orders to.
Shorter Product Cycles Make Delivery Capability the Leader’s Edge
Competition among optical module companies is becoming more like a race in continuous R&D; and mass-production management. Surveyed companies believe datacom product cycles may shorten to one to two years, versus telecom product cycles of about five years. The cycle here refers to product iteration pace, not module service life; for manufacturers, it means R&D; spending must convert into sellable products faster.
When speeds, packaging, and customer specifications keep changing, one mature product line is not enough to cover all demand. Companies must simultaneously handle multiple models, coordinate new component introduction, adjust test plans, and replicate pilot results into mass production. Product upgrades create higher value but also increase R&D;, inventory management, and delivery complexity. Each generation requires investment; only scale sales within the customer procurement window can effectively amortize costs.
Zhongji Innolight’s supply-chain collaboration is worth understanding in this context. Goldman notes that it secures supply through joint R&D;, direct investment in suppliers, prepayments, and long-term agreements. Joint R&D; lets upstream suppliers match next-generation product requirements earlier; investment and long-term agreements improve supply stability; prepayments convert part of capacity assurance into upfront capital. Together, these arrangements improve delivery visibility, rather than merely seeking lower procurement prices.
These advantages also carry costs. Prepayments tie up cash, supplier investments carry operating risk, and long-term purchase commitments require end demand. If demand falls short or the product roadmap changes, resources locked in early may not all be used efficiently. Supply-chain control therefore cannot be measured only by how much capacity is locked; it also depends on whether gross profit from incremental shipments covers R&D; and capital costs.
This cycle favors leaders when technology upgrades are fast enough, customers demand reliable delivery, and leading companies can continuously convert collaboration into sales share. Conversely, if key materials rapidly commoditize, product differentiation narrows, or customers actively diversify procurement, incumbents’ advantages may weaken. The industry boom provides demand for all, but profit is more likely to concentrate in companies that deliver consistently and make fewer mistakes.
CPO Changes Both Connectivity and Value Allocation
CPO, or co-packaged optics, shifts optical functions more tightly around the switch chip, shortening high-speed electrical signal paths. Nvidia’s official technical material describes its approach integrating silicon photonics with the switch chip and placing a serviceable external laser source in front-panel pluggable modules. Optical functions are reorganized; the components themselves do not disappear. Nvidia official technical note
This architecture changes the division of labor in the supply chain. Some functions in traditional pluggable modules move into a tighter integrated system, with system makers, advanced packaging players, optical engine suppliers, and precision connector makers potentially taking on more work. Growth in total optical interconnect value does not guarantee that the traditional module manufacturing segment captures the same proportion. To judge whether a company benefits, one must confirm whether the products it supplies to customers remain in a critical position in the next-generation architecture.
Commercialization also faces specific technical thresholds. Supply-chain feedback indicates that 300–400 mW continuous-wave (CW) lasers for CPO external light sources still face thermal management challenges, so the industry is first advancing >100 mW solutions in NPO. NPO, or near-packaged optics, is another integration approach that places optical functions closer to compute or switch chips. NPO and CPO can mature at different paces; they should not be treated as large-scale replacements at the same point simply because their direction is similar.
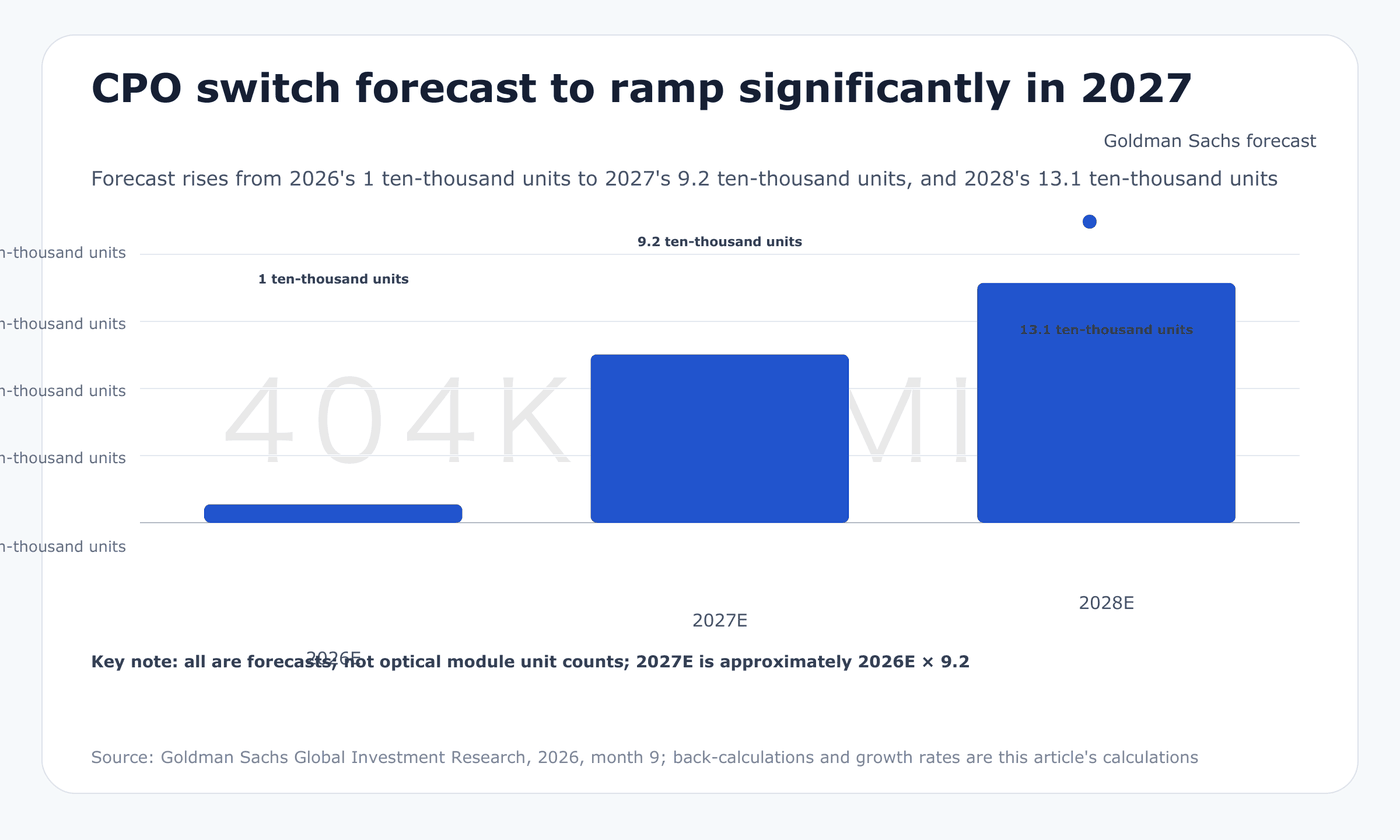
Goldman estimates CPO switch volumes of 10,000, 92,000, and 131,000 units in 2026–2028. The forecast implies 2027 is about 9.2x 2026, and 2028 grows another ~42.4%. The rapid ramp from a low base reflects relatively optimistic commercialization assumptions; these are switch units, not directly comparable with optical module units, and cannot be converted into optical engine market size without per-switch configurations.
These forecasts imply two business rhythms may coexist. On one side, pluggable high-speed modules continue to serve AI buildout; on the other, CPO-related R&D;, equipment procurement, and line preparation gradually increase. For module companies, the priority is generating cash flow from current demand and proving they can participate in next-generation products; for new technology suppliers, the key is converting samples and validation projects into repeatable volume orders.
Why Test Equipment May Ramp Before End Systems
Rather than debating the year CPO becomes ubiquitous, the manufacturing side is already showing more concrete operating changes. Data cited by Goldman show RoboTechnik’s Q2 2026 revenue rose 172% QoQ and came in 141% above its original forecast. This is a research report relaying actual quarterly operating data; the two percentages are against the prior quarter and the original forecast, respectively, and neither is YoY. It supports the view that equipment demand is emerging early, but a single quarter is not enough to determine long-term growth.
Equipment benefits first for clear production reasons. As integration rises, if a defective photonic chip is only found after expensive packaging, the loss includes not just the bare die but also downstream processing, packaging, and testing costs. The earlier problems are identified, the more cost is avoided on products that cannot be delivered. Known-good-die (KGD) screening has direct economic value here.
Enlitech’s NightJar targets earlier-stage optical defect screening; RoboTechnik and FiconTEC are advancing wafer and die testing. Companies want to eliminate defects at different production stages rather than concentrating all inspection at the final product stage. Whether added test steps create value depends on whether the defective losses they reduce exceed the added equipment, test time, and maintenance costs.
Efficiency upgrades also improve capacity. RoboTechnik and FiconTEC set 2027 targets to cut wafer test time by 50–60% and raise die test speed fourfold. If testing was originally limiting line throughput, these improvements can alleviate the bottleneck; if other steps are slower, local test speedups will not translate proportionally into factory-wide output gains. These remain company targets; stable operation, false-call rates, and actual takt in mass production need further observation.
Coupling equipment offers another example. GMT’s 1.6T dual-FA active alignment equipment can handle both transmit and receive sides simultaneously, saving about 50% of coupling time versus traditional methods. The improvement is in the coupling step and cannot be extrapolated to mean total factory costs fall by half. Whether customers buy depends on comparing equipment price, precision, product compatibility, and retrofit costs for old and new lines.
RoboTechnik and FiconTEC target equipment shipments over the next year exceeding half of their cumulative shipments over the past 25 years. This target reflects strong expectations for industry expansion and implies production organization, delivery, and after-sales support must expand in tandem. Its denominator is cumulative shipments over the past 25 years; it cannot be written as 50% YoY growth, let alone used to directly infer revenue growth, because equipment prices and configurations can vary widely.
Equipment investment usually occurs before mass production. Equipment revenue growth can therefore lead terminal deployment but may not repeat the same increase every year. If customers buy in a concentrated wave early and then enter a capacity digestion phase, equipment orders may slow. To judge the sustainability of equipment companies, one needs to see new line customers, repeat orders, and actual acceptance; a one-time expansion order peak cannot be permanently capitalized.
Rising Channel Counts and Laser Power Create New Manufacturing Challenges
Specification upgrades place higher demands on some easily overlooked steps. FOCI plans to move from 40-channel fiber array units (FAUs) for 3.2T to an 80-channel solution for 6.4T, with 100-channel still in R&D.; The 40-channel product is set to ramp from Q3 2026, and the 80-channel is planned within the year. More channels mean more connections must maintain precise alignment and stable operation in limited space.
Goldman links FOCI’s revenue acceleration to the high-end FAU ramp: revenue rose 9% and 20% MoM in July and August 2026, respectively. This provides a clue closer to operating results than a product roadmap alone, but it still does not prove how much revenue or profit each added channel generates. Doubling channel count does not automatically double ASP; customer pricing, manufacturing yield, and competitive intensity can all change value distribution.
Laser specifications are also moving up. The CW laser power LandMark Optoelectronics serves extends from 70–100 mW for lateral interconnect applications to >100 mW for NPO and 300–400 mW for CPO. Higher power and different integration methods create new demand for material and device suppliers while increasing thermal management and reliability requirements. For 200G EML, “200G” is speed; for CW lasers, “mW” is power. The two upgrade paths cannot be conflated into one performance metric.
Rising FAU channel counts, higher laser power, and test equipment upgrades are in fact interrelated. More complex connections and more demanding devices increase the importance of precision manufacturing and inspection. Which company earns more depends on whether the added difficulty creates customer-recognized differentiation and whether the company can deliver with stable yield; leading on specs without cost control can mean revenue growth accompanied by margin pressure.
Far-Out Valuations Are Most Vulnerable to Profit and Timing Slipping Together
Upward demand revisions can raise earnings expectations but do not directly prove stock prices are reasonable. Goldman’s valuations for some companies already rely on far-forward earnings: LandMark Optoelectronics uses 2029E profit, RoboTechnik uses 2031E, and ASMPT uses 2030E, then discounts back to 2027. This means valuation bets not only on demand direction but also on the operating scale companies can reach after years of expansion.
To understand these valuations, decompose future value into three parts: profit in a given year, the P/E multiple investors are willing to pay, and the discount factor bringing future value back to the valuation base date. Profit below expectations reduces value; lower growth expectations may compress the multiple; commercialization delays extend waiting time. The three variables can also move simultaneously, making stock volatility greater than current performance changes.
Using RoboTechnik’s 11.3% cost of equity as a pure sensitivity illustration, assuming profit and valuation multiple are unchanged and the same earnings level is achieved one year later, discounted value falls by about 10.2%, calculated as 1 − 1 ÷ 1.113. If forward profit is also 20% below the original assumption, value is about 0.8 ÷ 1.113, or 71.9% of the original, down about 28.1%. This is not a new price target; it illustrates the combined impact of “one year later” and “earning less.”
Revenue growth also needs to be broken down. If a module company’s shipments track the global 800G-and-above demand forecast, with 2028 volume up 18.75%, and assuming share and product mix are unchanged while ASP falls 10%, revenue growth is about 6.9%, or 1.1875 × 0.9 − 1. If the ASP assumption changes to a 5% decline, revenue growth is about 12.8%; at a 15% decline, growth is only about 0.9%. These are hypothetical scenarios, not substitutes for a company’s own product mix forecast.
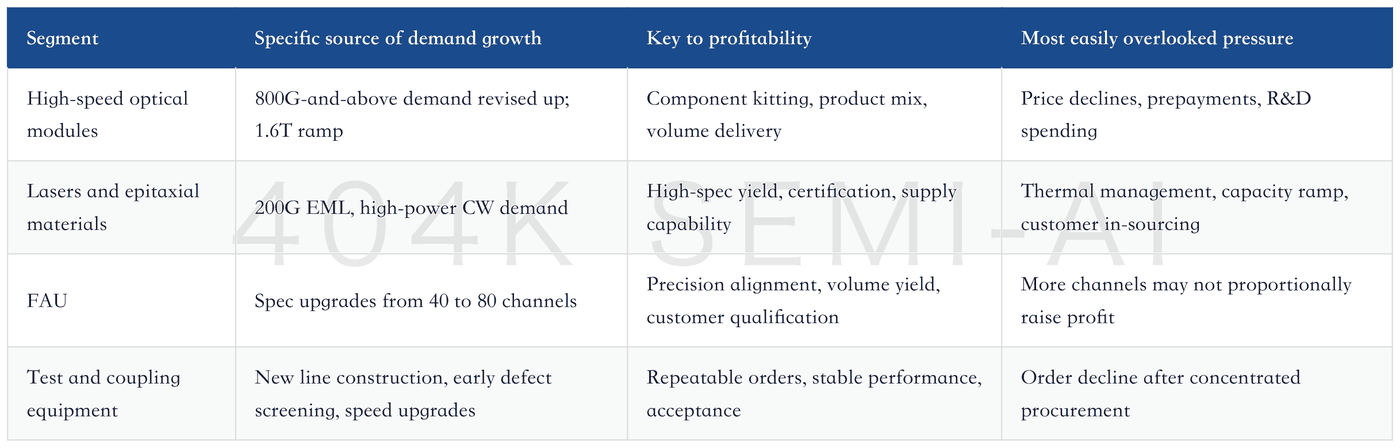
This calculation shows that a larger demand scale does not mean every income statement metric is equally strong. A higher mix of high-value products such as 1.6T may offset some same-spec price declines; R&D;, depreciation, and labor costs affect how much profit incremental revenue leaves. For module makers, watch product mix and delivery efficiency; for equipment makers, order cadence and acceptance; for material makers, high-spec yield and customer adoption.
Growth Across Segments Requires Different Profit Validation
What to Track Next
Supply-chain management remains optimistic about the sustainability of AI spending, discussing a 10- to 20-year technology cycle, some customers’ plans extending beyond 2030, and demand over the next two to five years. Respondents also believe deeper customer involvement in supply coordination can reduce information gaps and double ordering. These judgments explain why companies are willing to expand capacity, but they cannot replace end utilization, order cancellation rates, and inventory data.
The discussion of a “one- to two-year investment payback period” reflects respondents’ views on related industry investment and cannot be extrapolated to all AI data centers or large-model businesses. Installing optical modules does not mean final applications have generated sufficient revenue; how long buildout demand lasts still depends on customer usage demand, economic returns, and capital arrangements. Supply-chain optimism about the future and verified end-market returns are evidence of different strength.
Over the next several quarters, observe layer by layer through operating results. First, see whether high-speed module shipments come with improving lead times and whether inventory and prepayments show abnormal accumulation; second, see whether the ASP/margin combination improves as 1.6T mix rises; then see whether new customers and repeat orders for test equipment can support recurring revenue after acceptance. LandMark Optoelectronics’ capacity expansion, FOCI’s high-channel product adoption, and thermal management progress for high-power light sources correspond to whether upstream supply can keep pace with demand.
The strongest disconfirming evidence would be simultaneous weakening across multiple segments: module orders grow but customer acceptance slows, material inventory rises after capacity expansion, repeat orders are insufficient after the equipment delivery peak, and CPO commercialization is delayed. In that case, shortage may turn into glut, and both forward profit and valuation multiples would need to be cut. Existing businesses cannot be ignored either; fluctuations in some companies’ solar, handset, auto, or traditional packaging operations could offset new optical communications profit.
Upward demand revisions in optical communications have already created a larger potential market. What determines enterprise value next is who can deliver reliably when key components are constrained, defend costs during product upgrades, and retain capabilities customers will pay for as CPO changes the industry’s division of labor. Only when these changes consistently flow into revenue, profit, and cash flow will forward growth have sufficiently solid operating support.