
Contents
1. Why Compute Bottlenecks Grant Power Landlords Pricing Power
2. ~5 GW in Contracted Capacity: How Far from Steady-State Cash Flows?
3. Unpacking High Margins: Cash Flow, Development Yields, and Leverage Dynamics
4. Company Profiles: Five Operators, Five Distinct Challenges
HUT: Strong Contract Protection Meets a Back-Loaded Delivery Ramp
WULF: Low-Cost Brownfield Sites Counterbalanced by Large Funding Needs
CIFR: Front-Loaded Delivery Windows Against Texas Power Uncertainty
APLD: Large Backlog Tempered by Heavy Structured Equity Claims
CORZ: Exceptional Legacy Margins Cannot Be Extrapolated to Greenfield Expansion
5. Target Price Upside: How Much Depends on the Unbuilt Pipeline?
6. The Risk of High Leverage: Correlated Downside Variables
7. The Next 12 Months: Connecting Four Catalysts into an Execution Chain
This content is compiled from publicly available information and research reports. It does not constitute investment advice or represent any individual's views. For educational reference only; please read critically.
The generative AI infrastructure boom is rapidly transforming Bitcoin miners into wholesale data center landlords. While secured utility power and multi-decade lease backlogs unlock unprecedented growth runways, heavy development capex, delivery bottlenecks, and capital-structure waterfalls will ultimately determine how much economic value accrues to common shareholders.
1. Why Compute Bottlenecks Grant Power Landlords Pricing Power
The core investment opportunity in North American AI infrastructure is shifting from who secures the best silicon to who can energize clusters on schedule. Procuring accelerators is only the first step. Servers generate commercial value only when installed in data centers equipped with adequate power capacity, advanced liquid cooling, and high-bandwidth networking. Grid energization delays of even a few quarters result in stranded hardware, deferred revenues, and compromised competitive positioning for frontier model builders.
On September 22, 2026, UBS initiated coverage on Hut 8 (HUT), TeraWulf (WULF), Applied Digital (APLD), Core Scientific (CORZ), and Cipher Digital (CIFR), assigning Buy ratings across the group. All target prices and scenario frameworks herein reference that research baseline, using closing prices as of September 18. The underlying investment thesis is straightforward: equity valuations are pivoting away from Bitcoin price-driven operational earnings toward utility-backed, long-term colocation and powered-shell leases.
Crucially, AI colocation must be distinguished from GPU cloud service providers. Data center operators supply high-density space, power distribution, cooling, and facility operations; tenants assume the risk of hardware procurement and compute commercialization. The accelerator owner, the data center lessee, and the end-user training or inferencing models are often three distinct entities. Landlord economics are governed by contracted lease terms rather than direct, uncapped participation in model revenues.
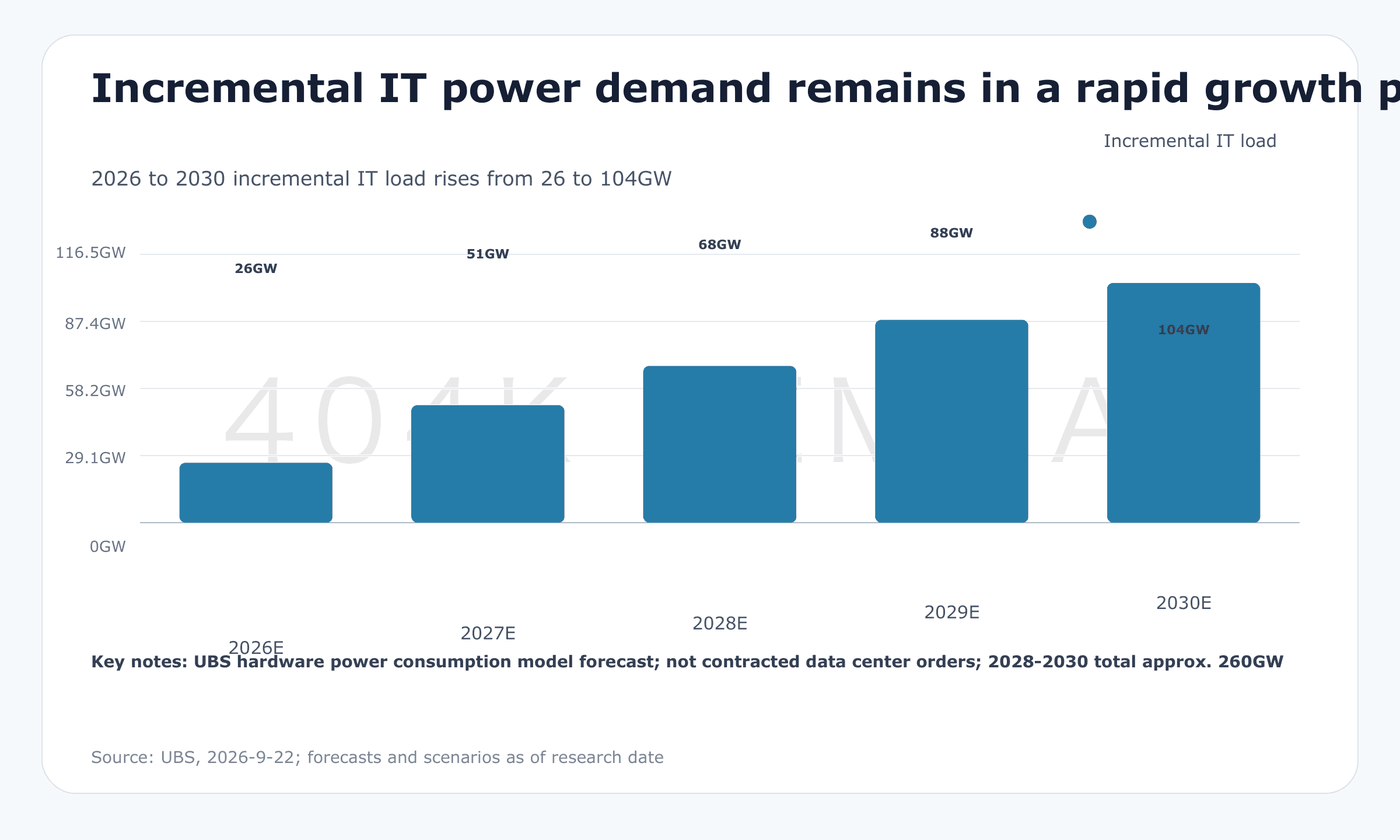
UBS’s hardware power model projects incremental global IT load of approximately 26 GW, 51 GW, 68 GW, 88 GW, and 104 GW annually from 2026 through 2030, totaling nearly 260 GW across the 2028–2030 window alone. This bottoms-up projection reflects accelerator shipment and thermal design power (TDP) assumptions; it does not assume that underlying land, utility interconnects, and leases are already secured. Structural shifts in accelerator power efficiency, model architectures, or workload utilization could alter required capacity.
Nonetheless, hyperscale demand remains immense. UBS projects aggregate cloud capex of ~$5.5 trillion from 2026 through 2029. Meanwhile, traditional Tier-1 data center vacancy rates sit below 2%, with transmission interconnection queues exceeding five years in key power markets. Leased capacity accounted for roughly 60% of North American data center absorption and self-build additions over the trailing twelve months. For hyperscalers, leasing external infrastructure mitigates development risk and accelerates time-to-market.
Miners secured their strategic positioning by locking up land, substation access, and utility relationships during previous cycles. However, legacy crypto mining sites cannot house high-density AI clusters without extensive reconstruction of building envelopes, liquid-to-air cooling loops, and power redundancy (e.g., N+1 / 2N architectures). Their competitive moat is early control of scarce development inputs, not turnkey, low-cost AI facilities. Valuing gross mining megawatts at mature data center transaction multiples risks overstating sellable IT capacity while severely understating required retrofit capex.
Furthermore, this time-to-market advantage has an expiration date. Customers pay premium rents only if miners deliver operational capacity materially ahead of greenfield alternatives. If grid interconnects, long-lead electrical equipment, or on-site construction slip, the option value of the underlying power pipeline deteriorates. Competitive advantage is shifting from gross power reserves to repeatable, institutional execution. This divergence explains why operators with multi-gigawatt pipelines trade at disparate valuation multiples.
2. ~5 GW in Contracted Capacity: How Far from Steady-State Cash Flows?
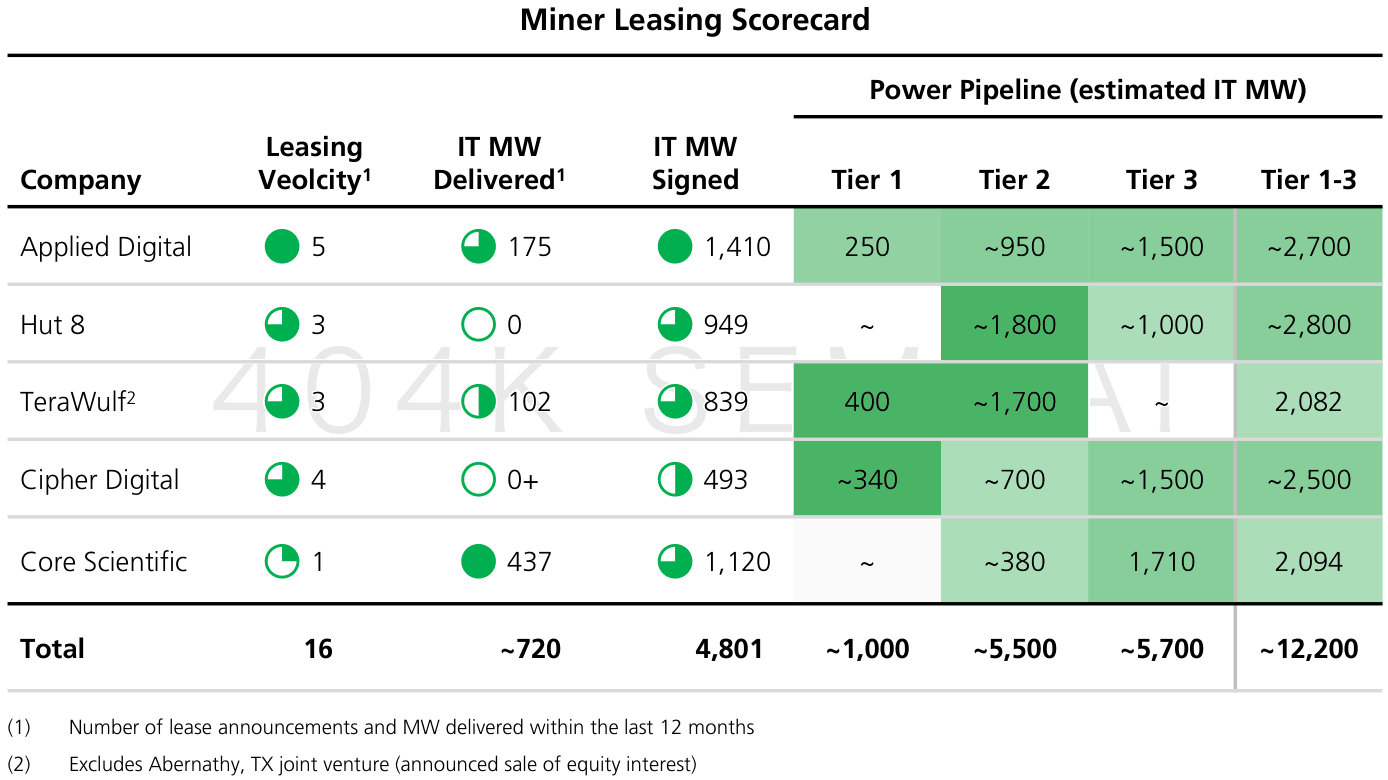
Across the five covered operators, contracted IT capacity totals ~4.8 GW, representing ~$125 billion in cumulative contracted revenue, supported by an additional ~12.2 GW development pipeline across varying stages of maturity. While long-term leases provide strong revenue visibility, UBS notes that only ~15% of contracted capacity is currently operational. The overwhelming majority remains in construction or financing stages, far from steady-state rent collection.
Standardizing power metrics is essential when evaluating these portfolios:
Gross Power vs. Critical IT Load: Total utility power must cover cooling and transmission losses; only critical IT capacity powers servers. Power Usage Effectiveness (PUE) measures the ratio of total facility power to IT load. Assuming a 1.25 PUE, 100 MW of gross utility power translates to ~80 MW of IT capacity. Comparing operators without standardizing gross power versus critical IT capacity distorts project scale.
Pipeline Maturity Stages: Operational capacity generates immediate cash flow; contracted capacity is under development; power-secured reserves require anchor tenants; and interconnection queues, due-diligence sites, and customer expansion options sit furthest from cash realization. UBS stratifies development pipelines with probability-weightings to avoid pricing early-stage options at parity with operational assets.
Backlog Duration: The $125 billion headline backlog spans 10- to 15-year lease terms and should not be conflated with annual run-rate revenue or immediate liquidity. Where contracts include annual rental escalators, average annual rent over the term exceeds Year 1 cash collections. Valuation requires determining stabilized, post-energization cash yields and discounting for the capital and duration required to reach commercial operation.
Delivery timelines dictate commercial viability and credit support:
Ready for Service (RFS): RFS is the contractual milestone that triggers rent commencement and activates parent-level credit backstops. In certain transactions, credit enhancements take effect only upon commercial delivery. Construction slippage creates a hazardous liquidity gap: equity capital is committed and debt service accrues, but cash rent has yet to commence and credit protections remain inactive.
Delivery Trajectory: UBS forecasts that cumulative contracted capacity will reach nearly 50% delivery by mid-2027 and ~90% by mid-2028. This delivery ramp provides a more rigorous yardstick for evaluating growth than long-dated pipeline totals. Structural milestones, substation civil works, and switchgear deliveries are useful leading indicators, but risk is fully retired only when energization, customer acceptance, and cash rent commencement sequentially align.
3. Unpacking High Margins: Cash Flow, Development Yields, and Leverage Dynamics
AI colocation leases exhibit high headline operating margins because power and facility operating expenses are predominantly passed through to tenants. Under standard triple-net (NNN) structures, tenants absorb property taxes, insurance, and routine maintenance, leaving landlords with concentrated rental revenue. However, cost allocations vary across contracts and require granular inspection rather than assuming complete operational risk transfer.
Net Operating Income (NOI) represents property revenues less property-level operating expenses, before debt service and corporate overhead. Development yield (unlevered return on cost) is calculated as stabilized or Year 1 cash NOI divided by total development capex. UBS finds that most contracted projects cluster in the 10%–15% yield range. While useful for comparing rent to construction costs, development yields do not equal levered project equity IRR, which depends on equity drawdown schedules, debt amortization, ongoing maintenance capex, and terminal exit multiples.
Consider a stylized $1 billion project generating $120 million in cash NOI (a 12% development yield):
Base Case Leverage: If funded with 80% debt at a 7% interest rate ($56 million annual interest), the remaining $64 million delivers a 32% cash return on the $200 million initial equity check. (This illustrative calculation excludes principal amortization, taxes, corporate overhead, and capitalized construction interest.)
Downside Sensitivity: If construction costs escalate by 10%—funded entirely with equity—while NOI remains flat, initial cash return on equity drops to ~21%. A 100 bps increase in borrowing costs adds $8 million in annual interest expense. Fixed rental contracts combined with floating or unhedged financing costs create a risk wedge absorbed first by common shareholders.
Accounting conventions introduce another divergence. Under straight-line lease accounting, total contractual rent with escalators is averaged evenly across the lease term. UBS highlights that recognized straight-line revenue in initial years can exceed actual cash rent collections by ~30%. While straight-line accounting inflates early-year income statement margins, the non-cash variance is deducted on the cash flow statement.
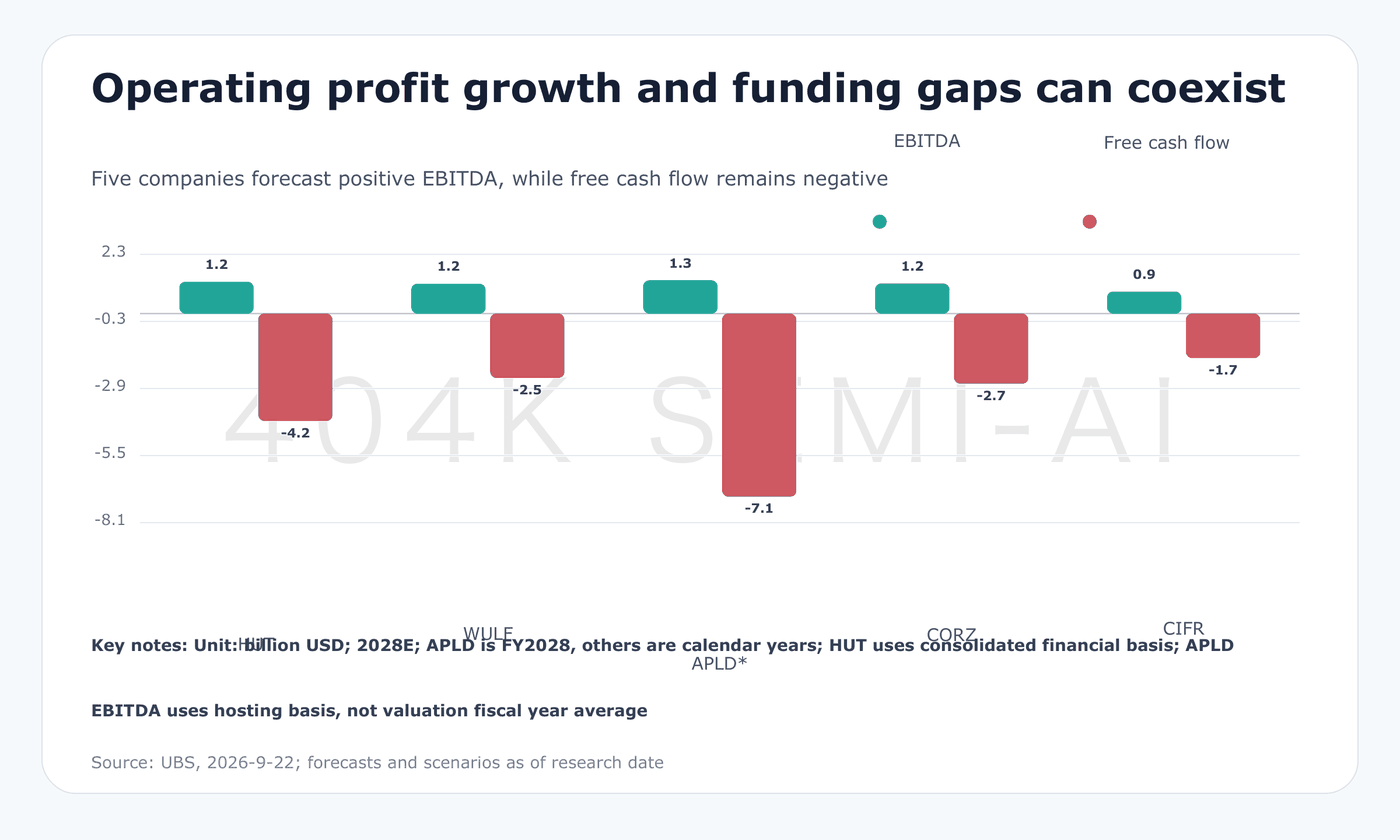
Evaluating EBITDA requires tracking underlying cash realization. UBS projects that all five operators will generate substantial negative free cash flow (FCF) through 2027–2029 as aggressive capex programs outpace operating inflows. For instance, in 2028, WULF is projected to generate ~$1.158 billion in EBITDA alongside negative FCF of $(2.488) billion; CIFR is projected to generate ~$854 million in EBITDA against $(1.722) billion in FCF. Expanding operating profits and ongoing external funding deficits are structural hallmarks of high-growth infrastructure development.
The central question is whether each successive growth phase can secure capital at manageable costs while generating contracted rents that exceed the hurdle rate. UBS estimates that while these five operators have raised ~$25 billion in project-level financing, another ~$24 billion in contracted project capex remains unfunded. Committed lease revenues must be evaluated alongside uncommitted future cost of capital.
4. Company Profiles: Five Operators, Five Distinct Challenges
HUT: Strong Contract Protection Meets a Back-Loaded Delivery Ramp
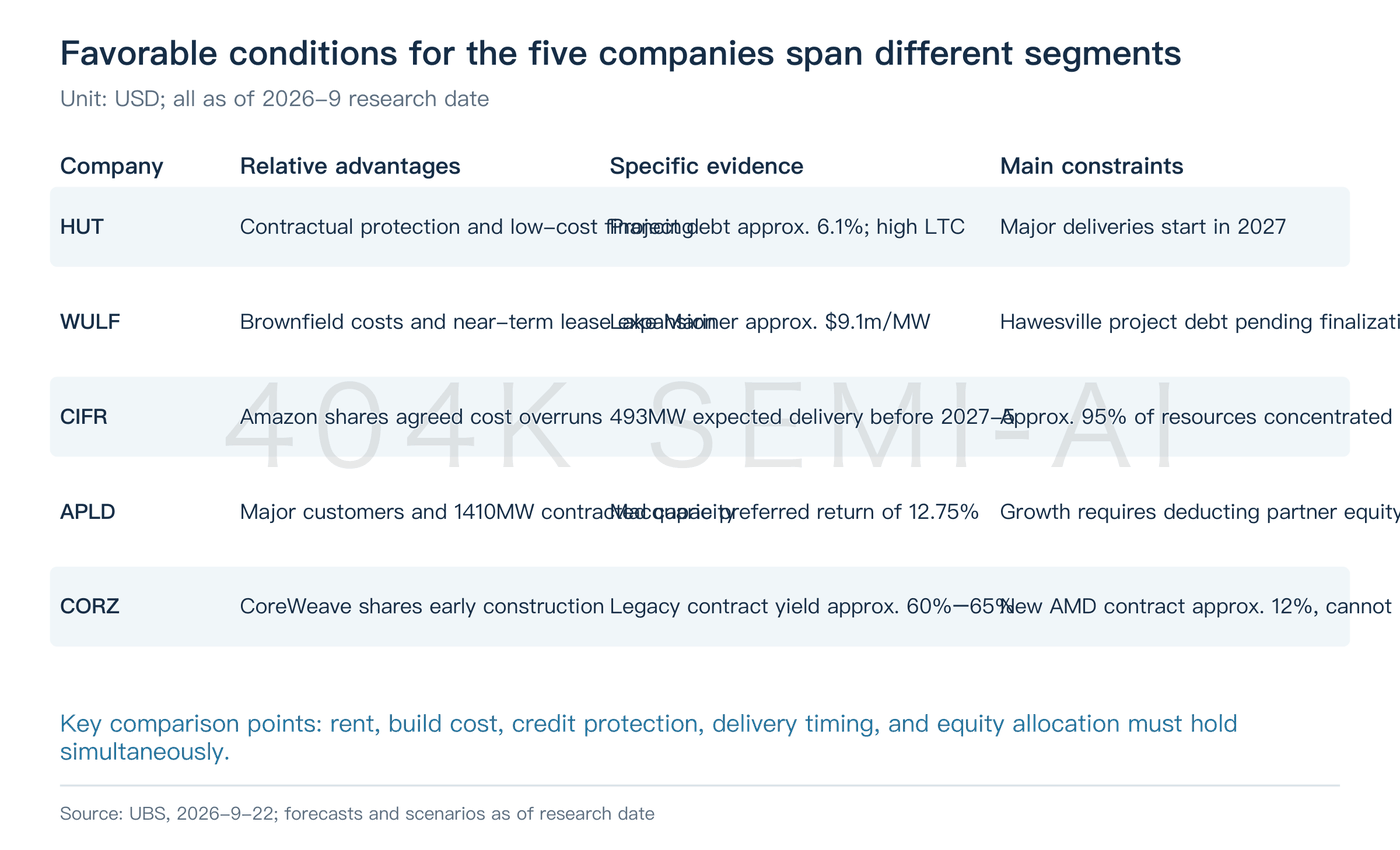
HUT differentiates itself through contract quality and debt terms. Its contracted IT capacity stands at ~949 MW, comprising River Bend (245 MW) and Beacon Point Phase 1 & 2 (352 MW each). The three leases represent ~$26.6 billion in contracted revenue over ~15-year terms. First-year NOI is approximately $1.5M per MW (MW150), against disclosed development capex of ~$9M–$11M per MW (MW900).
River Bend benefits from comprehensive credit support from Google, secured without issuing equity warrants. Delay provisions beyond ~180 days emphasize cure and step-in rights rather than lease termination, and rent abatements are capped. While mitigating tail-risk default, these provisions do not eliminate construction execution risk or conditions precedent to credit support.
Credit enhancements directly lower borrowing costs. River Bend and Beacon Point Phase 1 secured a combined ~$7.5 billion in debt financing at an aggressive ~95% loan-to-cost (LTC) ratio, with issuance yields of ~6.19% and 6.13%. UBS highlights this as a benchmark for achieving investment-grade project-debt pricing among digital infrastructure peers. Counterparty credit quality, contractual protections, and fixed-price capex caps make high leverage accretive.
The primary trade-off is execution timing. River Bend's initial 65 MW is scheduled for Q2 2027 delivery, with the full 245 MW targeted by year-end 2027. Beacon Point Phase 1 begins delivery in Q3 2027, followed by Phase 2 starting in Q2 2028 and extending through ~2029. At UBS's initiation date, HUT had zero operational AI capacity; its superior contract terms remain execution-dependent.
Additionally, consolidated financials include American Bitcoin operations, distorting segment comparability. UBS derives its price target using standalone colocation EBITDA. Investors must isolate core hosting economics to avoid conflating Bitcoin price volatility with data center operational execution. Maintaining HUT's valuation premium requires delivering its inaugural gigawatt-scale campus on schedule and replicating investment-grade financing terms on future phases.
WULF: Low-Cost Brownfield Sites Counterbalanced by Large Funding Needs
WULF has contracted ~839–840 MW of IT capacity across relationships with CORE42, Fluidstack, and Anthropic, generating ~$27.29 billion in contracted revenue. Lake Mariner leverages existing industrial infrastructure and power access, with capex guidance of ~$9.1M per MW (MW910); Hawesville is guided at ~$10M–$12M per MW (MW1000), reflecting relatively competitive unit costs.
Low unit costs do not insulate against customer change orders. At Lake Mariner, tenant-requested design modifications added ~$150 million in capex in exchange for ~$300 million in incremental rent over 10 years. While headline nominal rent is 2x incremental capital, UBS calculates that discounting cash flows at a 10% hurdle rate results in only modest net present value (NPV) accretion. Value creation hinges on whether contract terms adequately compensate for scope adjustments and duration drag.
On execution, Lake Mariner has energized ~102 MW, with a target to complete all 438 MW by March 2027 (UBS models full commercial ramp in Q2 2027). Hawesville is slated to commence delivery in late 2027 and complete by mid-2028. Operational delivery enhances execution credibility, though subsequent phases face regional labor and long-lead electrical supply chain bottlenecks.
Financing remains the next hurdle. Hawesville requires ~$4.4 billion in development capex, with project debt uncommitted at the time of coverage. A prior ~$1.1 billion equity raise provides the equity check for an ~80/20 debt-to-equity capital structure. While Google provides debt credit enhancements, it received equity warrants, with guarantees activating only post-RFS and stepping down alongside debt amortization. Lower debt yields must be weighed against common equity dilution.
Muskie Phase 1 (~400 MW IT) represents WULF's primary expansion pipeline, targeting energization in 2H 2028. Its appeal stems from mature power interconnection and tenant relationship expansion, but remains contingent until an anchor lease is signed and non-recourse debt is placed.
CIFR: Front-Loaded Delivery Windows Against Texas Power Uncertainty
CIFR has contracted ~493 MW of critical IT capacity across Barber Lake, Black Pearl, and Stingray, representing ~$11.3 billion in contracted revenue at an estimated ~14% development yield. Under the agreements, Amazon absorbs construction costs above $9.5M per MW (MW950) at Black Pearl and above $10.5M per MW (MW1050) at Stingray, providing a clearer mechanism for sharing cost overruns.
These protections must be decoupled from financing risks. Barber Lake features Google debt support that activates post-RFS and carries warrant dilution; it does not provide an unconditional construction guarantee. Delivery dates for contracted sites are front-loaded: January 2027 (Black Pearl), February 2027 (Barber Lake), and May 2027 (Stingray), providing near-term cash flow visibility, though Stingray faces a compressed construction window.
Power availability presents CIFR's largest operational variable. Approximately 95% of its portfolio is concentrated in Texas (ERCOT). Near-term pipeline candidates represent ~477 MW of gross utility power, translating to ~343 MW of critical IT capacity across Reveille, Ulysses, and Odessa. The remaining multi-gigawatt pipeline is dispersed across baseload, under-study, and temporarily excluded categories under Texas utility proceedings, meaning not all pipeline megawatts can be treated as firm power.
Regulatory load classification directly dictates whether leases can be executed, delivery timing, and commercial pricing. Even favorable categorization does not guarantee transmission buildout schedules, and non-firm capacity remains subject to curtailment during peak grid stress. CIFR's competitive strength is rapid near-term commercialization; its primary risk is single-market power concentration for future expansion.
APLD: Large Backlog Tempered by Heavy Structured Equity Claims
APLD’s ~1,410 MW contracted IT capacity is the largest among the peer group, comprising ~400 MW with CoreWeave, ~200 MW with Oracle, and ~810 MW with an unnamed high-investment-grade hyperscaler. (While UBS has an internal view on counterparty identity, institutional convention requires treating unconfirmed counterparties as anonymous.) Total contracted revenue stands at ~$36.2 billion.
Unit economics diverge from HUT and CIFR. UBS estimates first-year NOI at ~$1.19M per MW (MW119), yielding a development yield of ~10%. While higher counterparty credit ratings lower debt spreads, they often correlate with lower initial cash rents. If initial rents on new contracts rise from recent benchmarks of ~$112/kW/month to UBS's modeled $130/kW/month (ceteris paribus), development yields would expand toward ~11.5%.
Crucially, economic upside is heavily shared with external capital partners. Macquarie's capital commitment entails ~$2.25 million per MW in funding, carrying a 12.75% preferred coupon, an initial ~10% common equity interest (stepping up to ~15%), and an exit hurdle targeting a ~1.8x MOIC (multiple on invested capital). UBS estimates the blended cost of this structured capital approaches ~20%, significantly above headline project debt rates.
While this structure relieves APLD's upfront equity funding burden and enables multi-campus scaling, external capital senior claims dilute common equity cash flows. Valuing APLD by applying peer EV/EBITDA multiples to consolidated EBITDA while overlooking preferred equity, minority interests, and convertible debt overstates equity value. Project feasibility and common equity accretion must be evaluated separately.
Near-term pipeline options include ~100 MW with Oracle and an expansion opportunity of ~150 MW (MW150) at another campus. Further out, the 1.2 GW Base Electron natural gas turbine project bypasses grid queue bottlenecks but introduces fuel supply, pipeline infrastructure, and turbine delivery interdependencies for its 2029–2030 deployment timeline.
CORZ: Exceptional Legacy Margins Cannot Be Extrapolated to Greenfield Expansion
CORZ was an early mover, signing ~590 MW across contracts with CoreWeave totaling ~$10.2 billion in contracted revenue. CoreWeave funded the bulk of retrofit capex, capping CORZ's own capital exposure at ~$1.5M per MW (MW150). Because CORZ's invested capital base was minimal, historical development yields reached an extraordinary 60%–65%. This anomalous return profile reflects tenant-funded capital expenditures and cannot be extrapolated to future greenfield builds.
The newer ~529–530 MW AMD-related leases exhibit normalized market economics: ~$6 billion in total development capex at a ~12% development yield. Capacity is split between direct leases with AMD and leases with an AMD-backed neo-cloud provider. While diversifying revenue, each tranche requires separate underwriting of underlying model demand, guarantee enforceability, and project financing.
AMD was granted ~6.5 million equity warrants in connection with long-term performance backstops, with additional warrants issuable if expansion options are fully exercised. While equity incentives secure Tier-1 tenant commitments and credit enhancement, they dilute equity per share. Accretion must be tracked per diluted share, not by headline megawatt additions.
CORZ holds ~1.924 GW in expansion options, though only a fraction has guaranteed grid energization; the remainder is subject to ERCOT studies or behind-the-meter generation. UBS conservatively models only ~400 MW of incremental conversion rather than full pipeline conversion. Consequently, signed assets and existing non-AI corporate infrastructure comprise a higher percentage of CORZ's target price (~80%). Its lower EV/EBITDA valuation multiple reflects residual counterparty concentration, execution complexity, and uncommitted financing for new builds.
5. Target Price Upside: How Much Depends on the Unbuilt Pipeline?
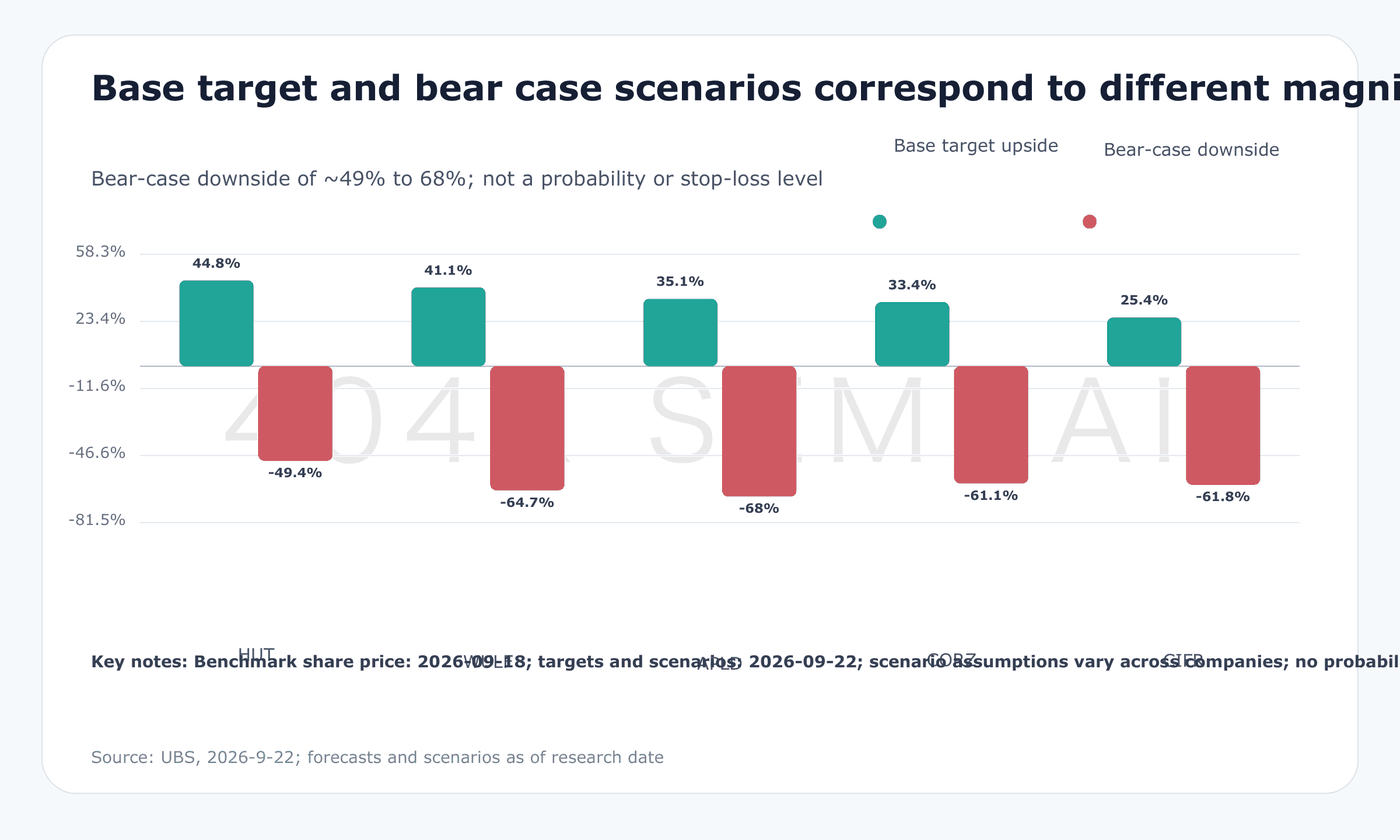
UBS’s 12-month target prices are $143 for HUT, $24 for WULF, $38 for APLD, $24 for CORZ, and $23 for CIFR, implying ~25%–45% upside relative to September 18 baseline prices across Buy ratings. These targets reflect valuation potential under modeled baseline assumptions and should not be viewed as assured outcomes or directly mapped to other trading dates.
Valuation relies primarily on EV/EBITDA: applying target multiples to forecasted operating profits, then adjusting for net debt, minority interests, preferred equity, and convertible dilution to derive common equity value per share. UBS applies 2028E EBITDA multiples of ~22x for HUT, ~19x for WULF, ~15x for CORZ, and ~20x for CIFR. APLD is valued at ~16x average FY28/FY29E EBITDA (approximating calendar 2028).
Out-year 2028 EBITDA is required because near-term earnings do not reflect operating run-rates for capacity currently under construction. However, out-year multiple valuation compounds model sensitivity: target prices depend on both flawless execution to hit 2028 EBITDA and market willingness to maintain premium multiples. If cost of capital increases or sector terminal multiples compress, identical earnings yield lower share prices.
Sum-of-the-Parts (SOTP) provides a complementary breakdown:
Contracted Assets: Valued by capitalizing stabilized cash NOI at target cap rates, deducting dedicated project debt, and discounting for construction duration and ramp-up periods.
Development Pipeline: Layered in based on site maturity, probability-weighted conversion, and implied value per megawatt.
Corporate Adjustments: Net debt and other corporate assets are added or deducted at the holding company level.
The capitalization rate represents the required return on stabilized cash flows; holding NOI constant, higher cap rates reduce gross asset value. Cap rates also embed market expectations regarding terminal value, asset quality, and post-lease re-contracting demand. For secondary or remote campuses, post-15-year salvage or renewal value directly dictates the multiple investors are willing to pay today.
Per-share SOTP breakdowns (UBS rounded figures):
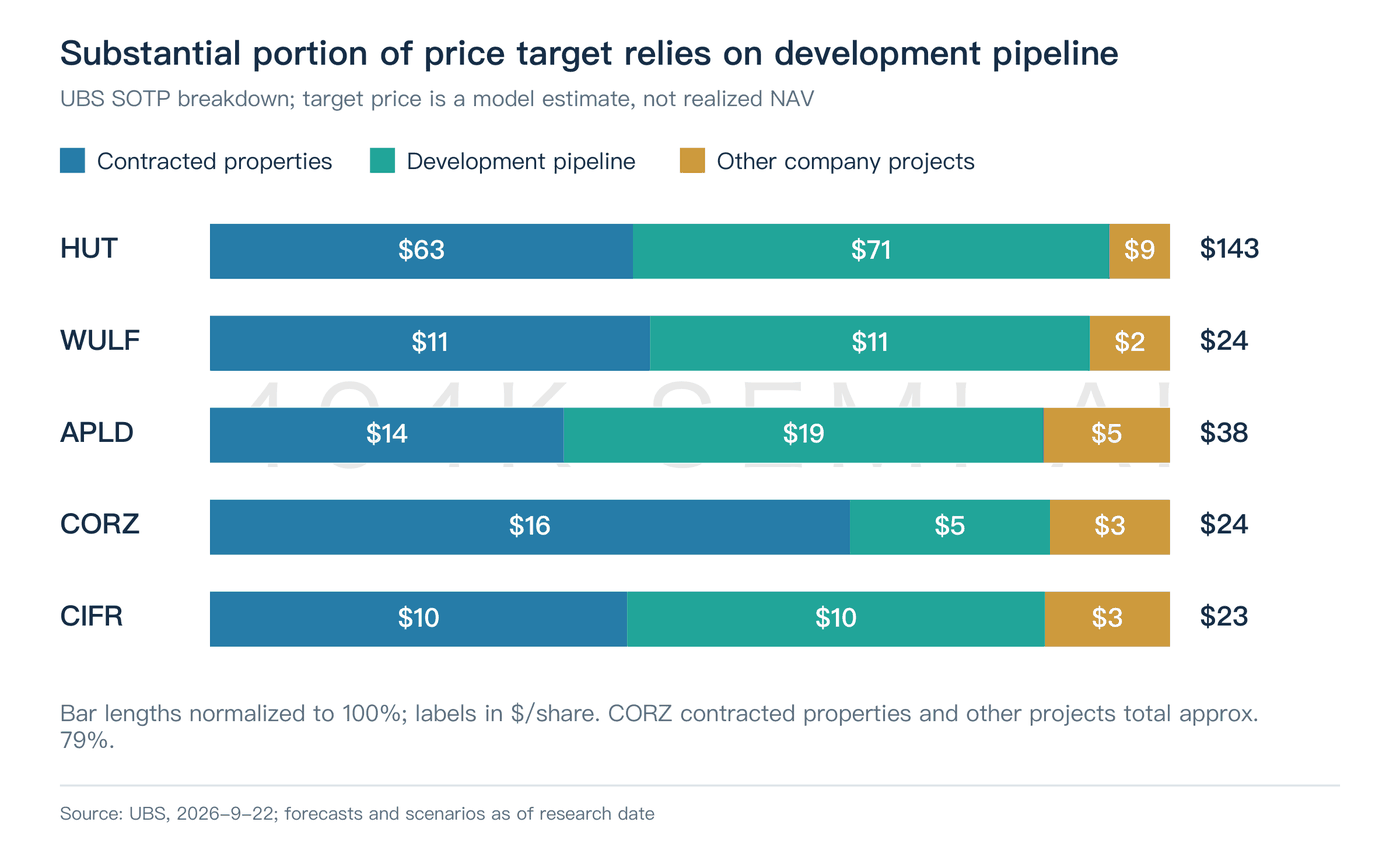
HUT ($143 total): ~$63 from contracted assets, ~$71 from development pipeline, ~$9 from corporate/other.
APLD ($38 total): ~$14 from contracted assets, ~$19 from development pipeline, ~$5 from corporate/other.
WULF & CIFR: Substantial proportions of total equity value are similarly driven by uncontracted development pipelines.
CORZ ($24 total): ~$16 from contracted assets, ~$5 from development pipeline, ~$3 from corporate/other (~80% of value derived from contracted and existing assets).
This decomposition reframes a common misconception: even if current share prices ascribe modest value to development pipelines, hitting target prices requires far more than merely completing existing contracts. For operators like HUT and APLD, realizing upside requires successfully contracting, financing, and constructing unbuilt pipeline capacity at targeted returns. Pipelines become accretive only when executed under economic terms.
Contracted asset value does not establish a hard valuation floor. SOTP equity values embed assumptions of stabilized rent, baseline cap rates, and on-time delivery. If construction costs inflate, rent commencement slips, or debt spreads widen, the equity value of signed assets contracts. Multi-decade contracts enhance revenue visibility, but they do not convert highly levered development platforms into risk-free bond proxies.
6. The Risk of High Leverage: Correlated Downside Variables
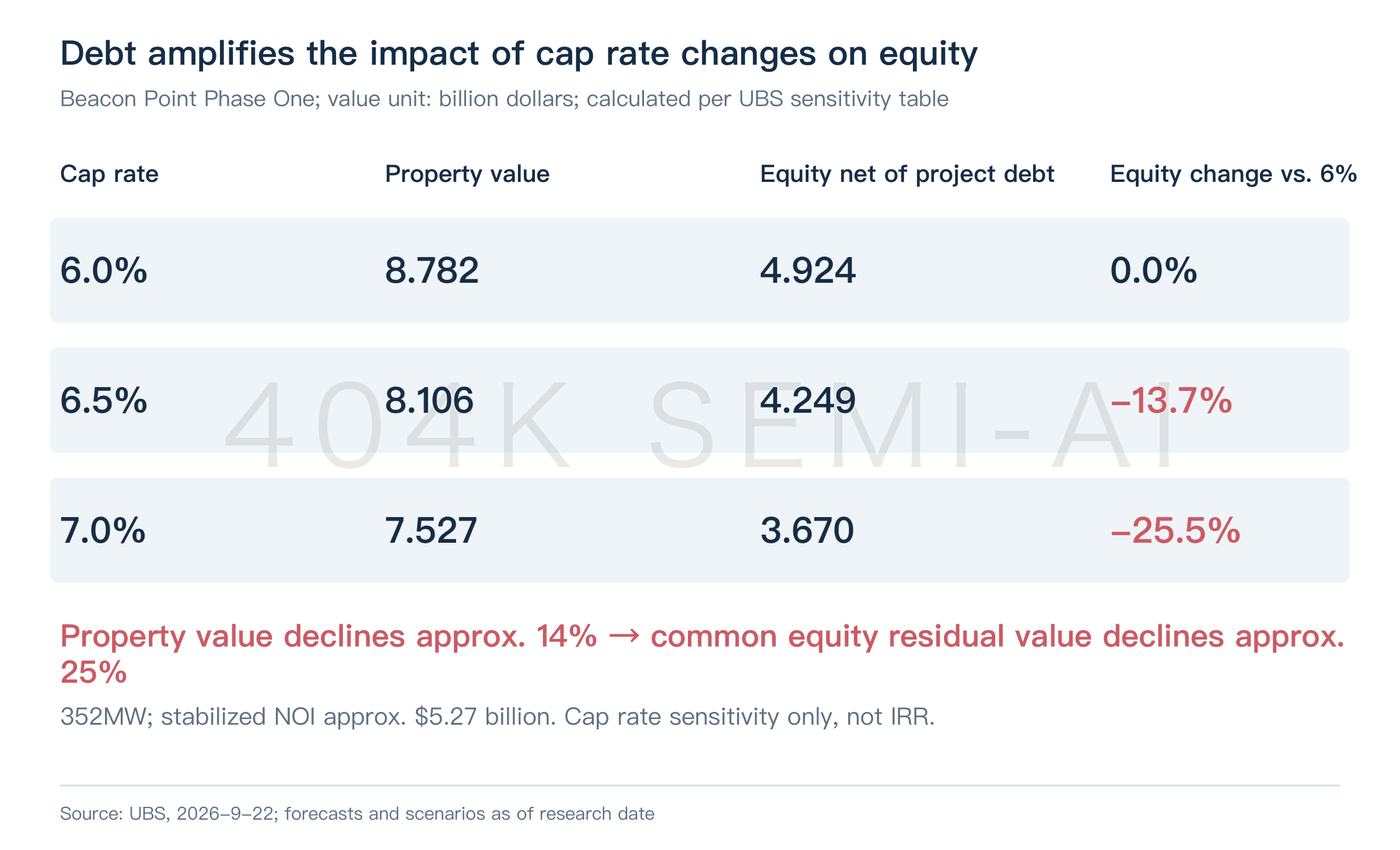
Beacon Point Phase 1 illustrates how leverage magnifies valuation sensitivity. UBS models ~352 MW of critical IT capacity, ~$527 million in stabilized cash NOI, and ~$338 million in capitalized construction interest:
Gross Asset Sensitivity: A 100 bps expansion in cap rate from 6% to 7% compresses gross property valuation from ~$8.782 billion to ~$7.527 billion (~14% decline).
Equity Value Compression: After deducting fixed project debt, project-level equity value contracts from ~$4.924 billion to ~$3.670 billion (~25% decline).
Leverage Mechanics: Because debt principal is non-dilutive and fixed, common equity absorbs 100% of residual asset value volatility. Modest revisions to operating assumptions or discount rates produce magnified swings in equity value. (This reflects cap-rate sensitivity, not levered project IRR.)
During construction, operational delays trigger compounding financial pressures:
Delayed rent commencement reduces near-term cash inflows;
Construction interest continues to capitalize onto the balance sheet;
Extended schedules drive up general conditions and EPC costs;
Tenants may trigger liquidated damages or contractual rent abatements;
Parent-level debt credit backstops remain unactivated until commercial acceptance.
Financing risks extend beyond benchmark monetary policy. UBS notes that credit spreads on non-investment-grade project debt have widened more aggressively than debt backed by high-grade credit enhancements. Market skepticism regarding tenant business models, contractor execution, or legal covenants widens borrowing spreads even in stable benchmark rate environments, disproportionately impacting projects with uncommitted debt.
High-grade counterparties mitigate credit risk, but nominal tenant diversification does not equal diversified end-user compute demand:
A neo-cloud tenant leasing shell capacity may sub-lease GPU clusters to a handful of frontier model labs;
A hardware vendor's leasing program may rely on those same AI labs.
Looking through intermediate entities, ultimate cash flows remain heavily tethered to frontier AI labs such as OpenAI and Anthropic.
Underwriting requires distinguishing between who signs the lease, who guarantees project debt, who purchases the compute, and what conditions trigger credit support. Conflating investment-grade corporate involvement with an unconditional, full-lifecycle guarantee understates equity-level execution risk.
Behind-the-Meter (BTM) generation presents similar execution trade-offs. While APLD’s gas turbine reservations and sector-wide BTM initiatives bypass public utility interconnection queues, WULF's power and battery storage initiatives illustrate that captive generation requires substantial incremental capital. Delivery delays in turbines, gas pipeline interconnects, fuel procurement, or environmental permitting substitute utility grid queue risk with industrial EPC delivery risk.
Longer term, technological shifts impact asset terminal value. Increasing rack power densities demand retrofits across liquid cooling, power distribution, and structural layouts, while algorithmic efficiency gains could moderate power requirements per compute unit. The ideal landlord environment is one where aggregate demand growth outpaces efficiency gains and leases contractually pass retrofit costs through to tenants. Continual customer change orders without commensurate rent adjustments risk margin degradation despite top-line growth.
UBS’s downside scenarios model target prices of:
HUT: ~$50 (-65% vs. Sept 18 baseline)
WULF: ~$6 (-68%)
APLD: ~$9 (-65%)
CORZ: ~$7 (-62%)
CIFR: ~$7 (-49%)
Bear case downside (-49% to -68%) significantly exceeds baseline target price upside (+25% to +45%). While UBS does not assign explicit probabilities to these scenarios, the asymmetry highlights that high revenue backlogs do not preclude severe equity downside under simultaneous delivery delays, capex inflation, and multiple compression.
7. The Next 12 Months: Connecting Four Catalysts into an Execution Chain
Fundamental performance over the coming year hinges on four sequential execution catalysts:
Physical Energization and Commercial Delivery:
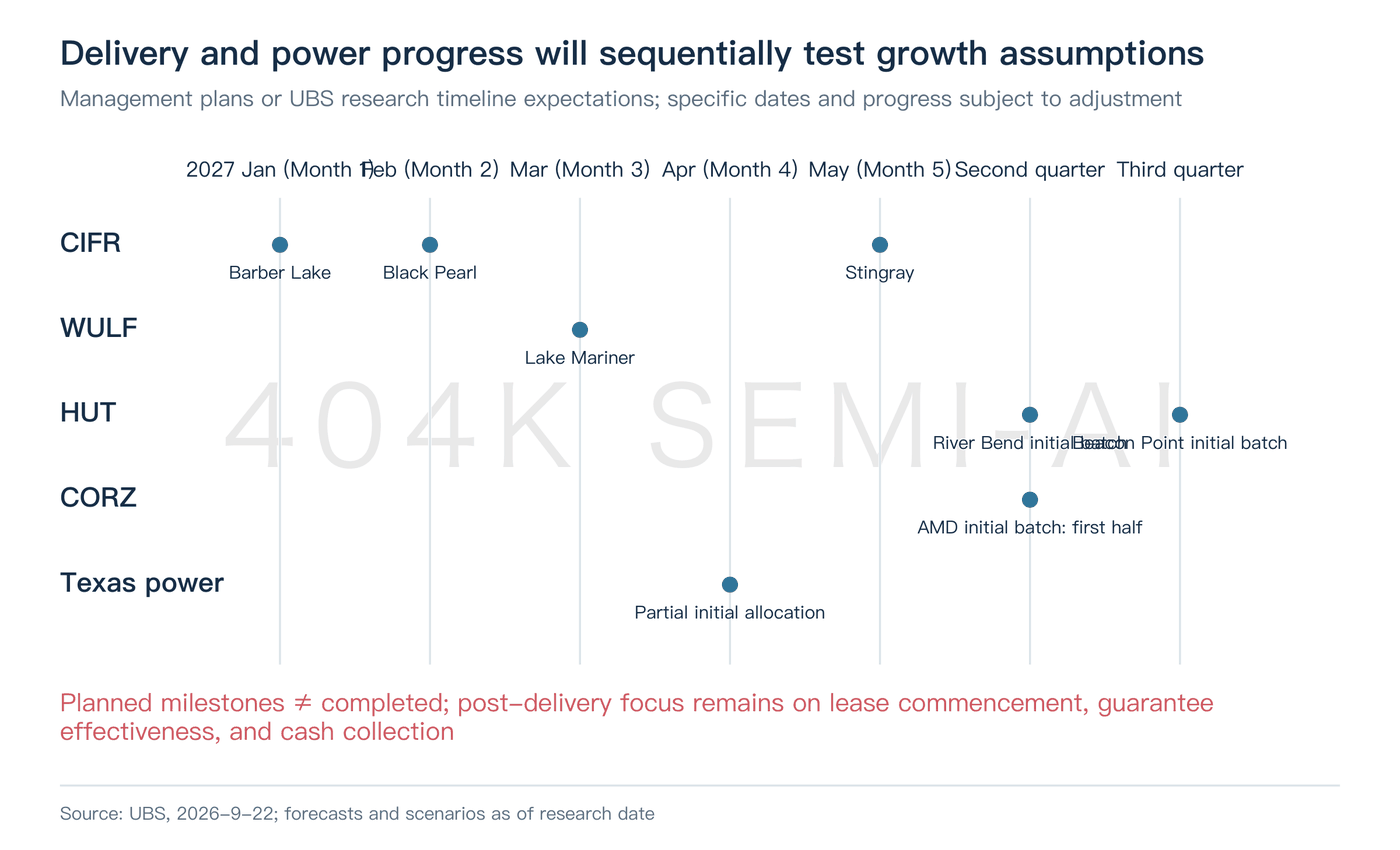
CIFR: Three contracted campuses scheduled for sequential delivery from early 2027 through May.
WULF: Lake Mariner targeted to complete major commercial ramp in Spring 2027.
HUT: Core delivery milestones begin across Q2 and Q3 2027.
CORZ: Initial AMD-related capacity slated for 1H 2027 energization.
Delivery dates alone are insufficient; cash rent commencement and the contractual activation of credit backstops are the true indicators of commercial de-risking.
Project Debt and Structured Capital Terms:
~$24 billion in unfunded contracted project capex must secure debt financing.
Underwriting must scrutinize all-in borrowing spreads, loan-to-cost (LTC) ratios, restrictive covenants, and debt amortization profiles, rather than headline facility sizes. Where funding incorporates preferred coupons, project-level equity concessions, or equity warrants, the net value leakage must be deducted from common equity value per share. Secured liquidity represents balance sheet progress, not automatic equity accretion.
Pipeline Conversion to Definitive Leases:
WULF's Muskie pipeline, APLD's ~250 MW tenant expansion options, CIFR's ~343 MW near-term IT candidate sites, and CORZ's AMD expansion options will determine medium-term EBITDA scale.
New lease announcements should disclose unit capex, Year 1 cash rents, counterparty credit support, and firm energization dates. Announcing higher headline backlog while accepting compressed unit NOI or heavier equity dilution degrades growth quality.
Texas (ERCOT) Regulatory Power Allocations:
Key regulatory milestones under UBS's coverage timeline include the December 2026 load categorization updates and April 2027 preliminary allocation determinations (dates and outcomes subject to regulatory revisions).
ERCOT developments are particularly critical for CIFR's pipeline valuation; across the sector, receiving regulatory classification must be distinguished from energized, transmission-backed power delivery.
Financial reporting will gradually validate execution:
Initial expansion in energized, operational IT capacity;
Subsequent inflection in cash rental receipts and cash NOI;
Eventual coverage of debt service and growth capex by operating cash flows.
Divergence warning: expanding consolidated EBITDA accompanied by stagnant cash rents, unit capex inflation, or widening funding deficits signals straight-line accounting distortion or capital delays.
Distinct strategic imperatives define each operator:
HUT: Prove that top-tier contract terms and IG-grade financing can be translated into on-time construction execution.
WULF: Scale its low-cost brownfield execution into sustainable multi-site growth.
CIFR: Translate front-loaded cash rent generation into secured, reliable power for its next expansion wave.
APLD: Retain a higher share of project economic upside for common equity holders against senior capital claims.
CORZ: Demonstrate that normalized, market-rate development yields on new leases generate attractive equity returns without historic CoreWeave-style tenant capex subsidies.
Flawless execution drives multiple expansion: as distant contractual revenue de-risks into operational cash yield, required discount rates compress. Conversely, if execution and balance sheet liquidity rely on perpetually optimistic capital markets, gross megawatts cannot substitute for free cash flow. For these emerging AI landlords, ultimate equity value will be determined by energized capacity, cash rent collected, and the residual value flowing to common equity after all senior capital providers are paid.