
目录
I. The Key Debate Lies Beyond Headline Growth
II. Why Doubling Bandwidth Does Not Automatically Double Revenue
III. Silicon Photonics Requires Both Cost and Product-Mix Support to Lift Gross Margin
IV. New Businesses Expand the Addressable Market but Increase Execution Risk
V. The Key Test for 2026: Second-Half Revenue Acceleration
VI. After Profit Expansion Comes the Cash-Flow Test
VII. The RMB 2,645 Price Target Requires Both Earnings and Valuation to Hold
本内容基于公开资料和研报数据整理,不构成任何投资建议,不代表任何个人观点,仅供学习参考,请理性阅读
The optical-module upgrade cycle is expanding Innolight Technology’s revenue and earnings potential, but a RMB2,645 price target requires more than industry growth. High-speed product ramp-ups, gross-margin expansion, and a valuation re-rating must all materialize, while the cash absorbed by capacity expansion will be a key constraint on the forecasts.
I. The Key Debate Lies Beyond Headline Growth
Innolight supplies the optical interconnect products that transmit data between data-center equipment. Optical modules convert electrical signals into optical signals and vice versa; what customers ultimately purchase is reliable network bandwidth. Larger AI clusters and increased chip-to-chip data exchange drive interconnect demand, but the revenue Innolight recognizes also depends on customers’ architecture choices, module counts, supplier selection, and delivery acceptance schedules.
In a September 7, 2026 research report, Goldman Sachs reinstated coverage of Innolight’s A-shares with a 12-month price target of RMB2,645. The report cited an A-share reference price of RMB814, implying approximately 225% upside. These figures reflect the report’s pricing basis and valuation judgment, not the probability of achieving that return. The real question is whether such a wide gap is driven by earnings forecasts or by the P/E multiple the market may be willing to assign.
Start with earnings. Goldman forecasts net profit of RMB40.432 billion in 2026 and RMB86.903 billion in 2027, respectively 25% and 42% above the consensus estimates cited for the corresponding periods. Consensus is an aggregation of analyst forecasts, not a predetermined operating outcome. Goldman is therefore arguing not only that the industry outlook is strong, but also that the market is underestimating Innolight’s growth rate. The divergence widens in the outer year, making the thesis increasingly dependent on product ramps that have yet to occur.
The source of that divergence requires closer examination. On page 9 of the original report, Goldman’s 2027 revenue forecast is 45% above consensus, while its net-profit forecast is only 42% higher; it assumes a higher gross margin but a slightly lower net margin. The above-consensus earnings forecast is therefore driven primarily by greater revenue scale, rather than a belief that profitability will far exceed market expectations. Assessing the report’s credibility should begin with shipments and revenue, not merely an attractive earnings curve.
II. Why Doubling Bandwidth Does Not Automatically Double Revenue
The progression from 800G to 1.6T and then 3.2T denotes successive transmission-speed tiers. Higher bandwidth can carry more data through the same number of ports and may allow customers to complete a given task with fewer connections. The link between a technology upgrade and procurement growth therefore depends on whether the ports, energy, or space saved are subsequently consumed by larger clusters and heavier communication traffic. A doubling of bandwidth alone does not imply a doubling of module volumes.
Goldman estimates volume and price separately, then multiplies them to derive market size. For 1.6T, it forecasts approximately 32.83 million units shipped globally in 2026 at an average selling price of approximately US$798, implying a market of approximately US$26.2 billion. In 2027, shipments rise to approximately 71.36 million units while the average price falls to US$750, taking the market to approximately US$53.5 billion. Growth is driven by volume expansion more than offsetting price erosion. These US-dollar prices are annual industry-model assumptions, not contract quotations for specific Innolight customers.
This distinction also explains why an industry leader cannot sustain long-term growth simply because high-end products command premium prices. A newly mass-produced product may initially carry greater value per unit, but the same generation typically faces price pressure as yields improve, competitors enter, and customers negotiate. Goldman expects the average selling price of 800G products to decline from US$440 in 2025 to US$314 in 2028, while 1.6T falls from US$840 to US$600. Its bullish model already incorporates within-generation price declines; the central assumption is that Innolight will continue shifting its shipment mix toward higher specifications.
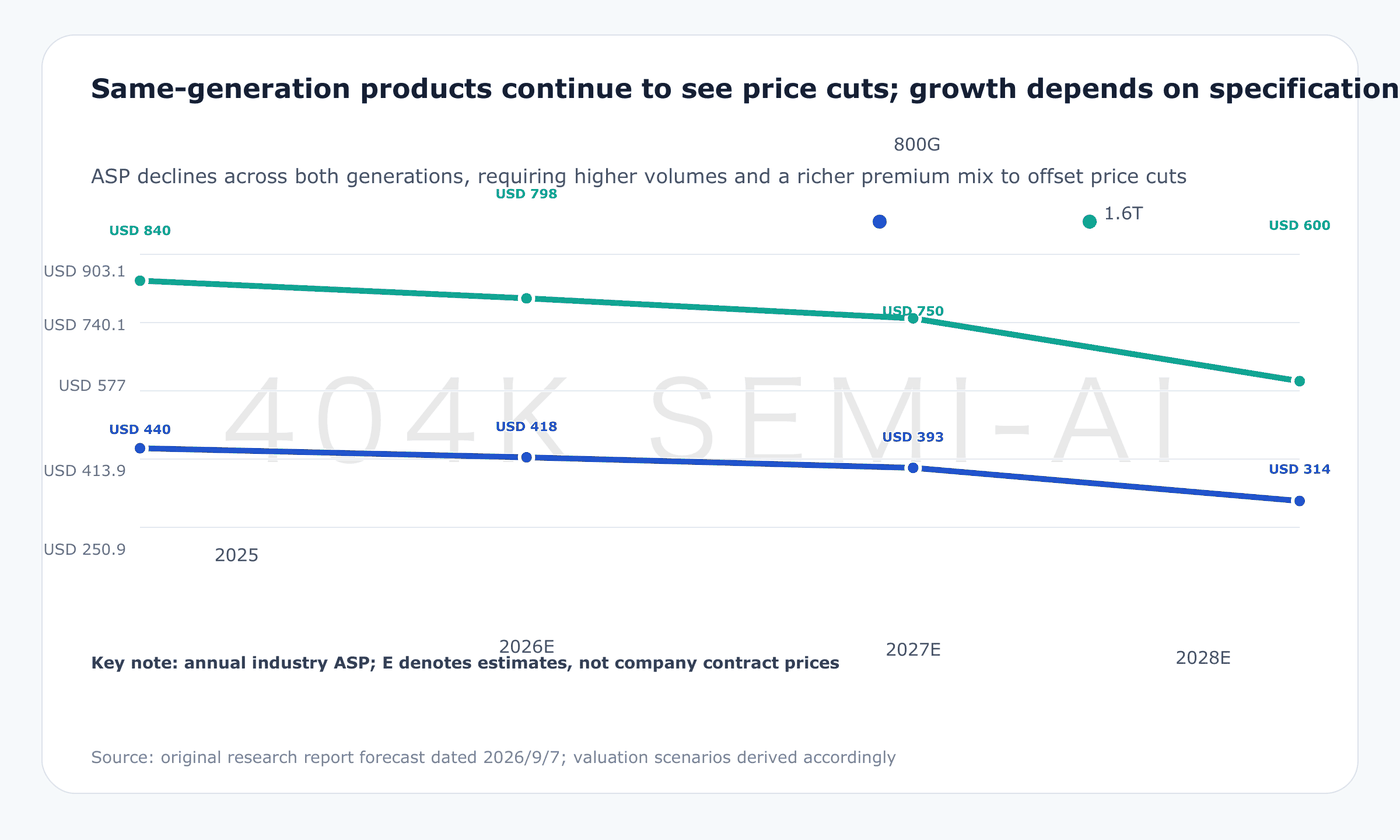
Generational transitions also mean that newer products displace older markets. Goldman forecasts the global 1.6T market reaching approximately US$53.5 billion in 2027 before declining to approximately US$32.9 billion in 2028; over the same period, the 3.2T market expands from approximately US$34.6 billion to US$81.3 billion. Peak market sizes for different generations and years cannot be added together as if they represented a simultaneous revenue pool available to one company. For Innolight, the critical issue is whether it can convert relationships from one generation into qualifications and orders for the next—not whether it can permanently retain the same share in every generation.
Technology leadership must therefore be demonstrated through execution. Before a new product can enter a customer’s network, it must meet performance, power-consumption, reliability, and supply requirements. R&D; leadership reaches the income statement only after customer qualification and mass production. Any shortfall in customer procurement timing, critical-component supply, or manufacturing yield could leave industry demand strong while Innolight’s revenue falls below forecast.
III. Silicon Photonics Requires Both Cost and Product-Mix Support to Lift Gross Margin
Silicon photonics, or SiPh, integrates certain optical functions onto a silicon-based platform. It changes how devices are integrated, manufactured, and packaged; it does not eliminate the cost of lasers, packaging, or testing from optical modules. The more investment-relevant questions are whether this architecture can reduce the cost per qualified unit and how much customers will pay for its performance.
The original report expects silicon-photonics products to increase from approximately 50% of Innolight’s shipments in 2025 to approximately 86% in 2028, while the company’s blended gross margin rises from 42.0% to 49.8%. Gross margin measures the gross profit retained from each unit of revenue after direct costs. Goldman attributes the improvement to a richer product mix and the stronger profitability of higher-end interconnect products. Taken together, these forecasts require the growing share of new products and improved cost efficiency to continually offset price declines within each generation.
The denominator matters when interpreting penetration rates. The report forecasts that silicon photonics will represent approximately 64% of global optical-module revenue and approximately 18% of global shipments in 2028, while accounting for approximately 86% of Innolight’s shipments. These figures measure revenue, industry-wide unit volume, and company-level unit volume, respectively, and are not contradictory. Higher prices for high-speed products create a substantial gap between revenue share and unit share. Conflating these measures would overstate Innolight’s market share or misjudge the adoption of silicon photonics.
Gross margin is also a highly sensitive variable in the model. Based on Goldman’s 2027 revenue forecast of RMB276.712 billion, each 1-percentage-point change in gross margin represents approximately RMB2.767 billion of gross profit. This is purely an arithmetic sensitivity assuming unchanged revenue; it excludes taxes, non-controlling interests, and other changes, and therefore should not be presented as an equivalent increase or decrease in net profit attributable to shareholders. Likewise, if actual revenue also falls short, weaker fixed-cost absorption could place further pressure on margins.
The investment case for silicon photonics therefore cannot rest on rising penetration alone. It requires simultaneous evidence of a larger revenue contribution from high-end products, lower unit costs or improved yields, and delivery of the projected blended gross margin. If product generations advance rapidly and revenue grows well but gross margin remains stagnant, competitive price cuts, higher critical-component costs, or mass-production expenses may be offsetting the technology benefit. The industry’s choice of technology and Innolight’s ability to earn higher profits from it are separate propositions that must be validated independently.
IV. New Businesses Expand the Addressable Market but Increase Execution Risk
Goldman does not view Innolight solely as a traditional supplier of pluggable optical modules. The report also incorporates scale-up and scale-across opportunities: scale-up focuses on connecting more computing resources into a more tightly coordinated system, while scale-across involves interconnecting computing infrastructure over a broader domain. For Innolight, this could extend customer demand to optical products with different requirements for distance, latency, and integration—not simply increase the volume of existing modules.
Potential products cited in the report include near-packaged optics, or NPO; co-packaged optics, or CPO; and optical circuit switches, or OCS. NPO and CPO place optical interconnects closer to computing or switching chips, while OCS connects systems by switching optical paths. Their commercial value lies in addressing new bandwidth, power, or interconnect challenges, but they may also alter customer-qualification requirements, supply-chain roles, and product-delivery models. Innolight’s existing module share does not automatically translate into equivalent share in these new products.
Goldman’s company model forecasts scale-up revenue of approximately RMB28.18 billion in 2027 and RMB70.75 billion in 2028, equivalent to approximately 10% and 17% of total projected revenue in those years. These contributions are already large enough to influence the overall growth narrative and cannot be treated merely as distant options requiring no validation. By contrast, scale-across revenue remains small in the model and should not receive equal weight in near-term earnings analysis simply because the concept appears strategically important.
These figures are analyst forecasts, not confirmed orders or management commitments. The most useful validation sequence is customer qualification, volume delivery, revenue contribution, and then profitability. If the new businesses remain at the sample and R&D; stages, growth in the existing business may still be insufficient to fill the incremental revenue embedded in the forecasts. If new technologies shift value toward chipmakers or other system suppliers, Innolight must also demonstrate that it can retain sufficient profitability under the new division of industry economics.
V. The Key Test for 2026: Second-Half Revenue Acceleration
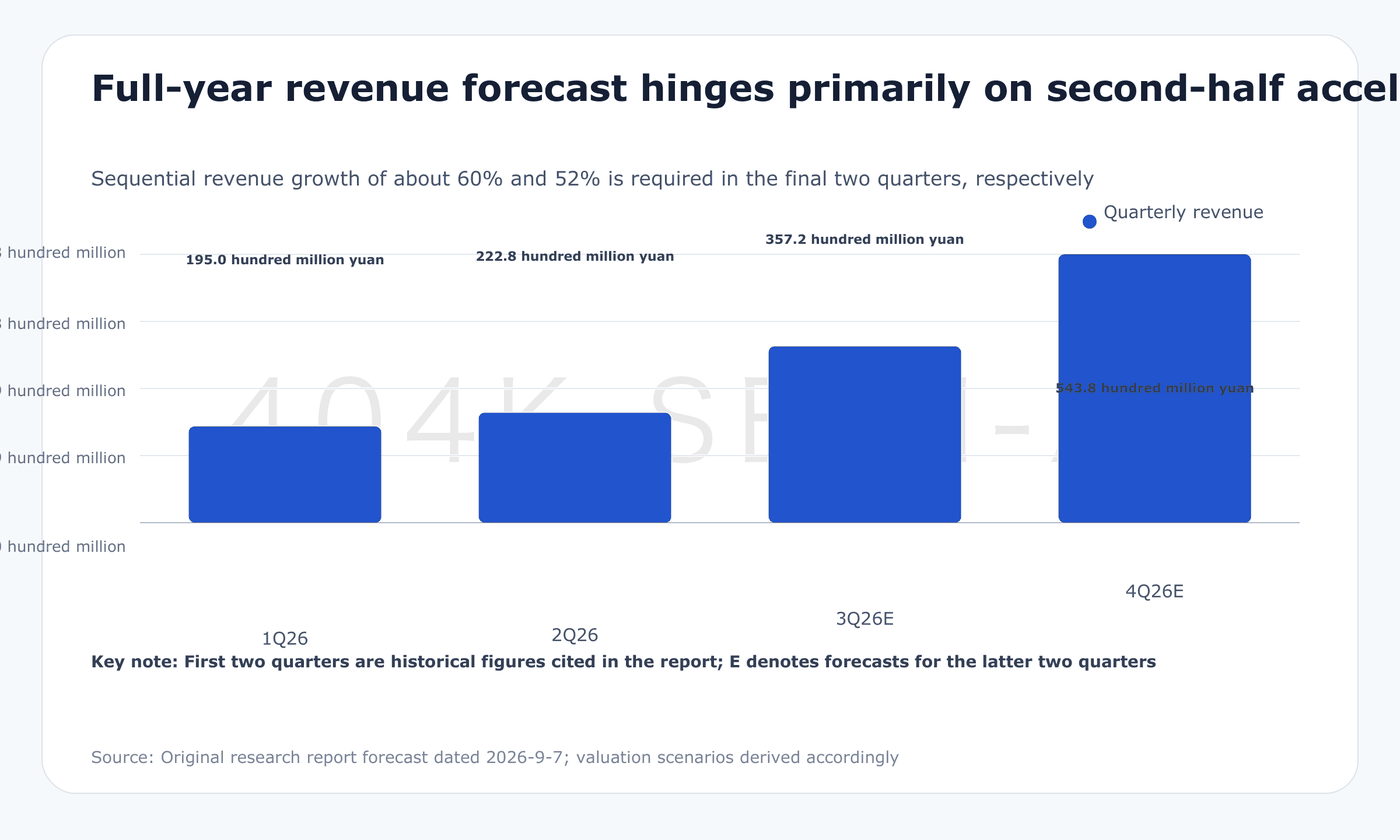
Long-term forecasts need to be validated by near-term operating results. The original report lists revenue of RMB 19.496 billion and RMB 22.281 billion for the first and second quarters of 2026, respectively, and forecasts RMB 35.716 billion and RMB 54.375 billion for the third and fourth quarters. The latter two figures imply sequential growth of approximately 60% and 52%, far above the roughly 14% recorded in the second quarter. This is not a smooth extrapolation of the first-half trend; it assumes a pronounced acceleration in deliveries.
Based on these quarterly figures, second-half revenue would reach approximately RMB 90.091 billion, versus RMB 41.777 billion in the first half—an increase of about 116%. On page 8, Goldman Sachs compares this with the roughly 47% half-on-half growth implied by consensus at the time and argues that next-generation AI systems and 1.6T adoption will support a faster ramp. The disagreement is therefore highly specific: both sides may accept the industry’s growth outlook, but differ on delivery pace, product mix, and the timing of order conversion.
If quarterly revenue falls short, investors must distinguish between delays and weaker demand. If customer qualification or component availability pushes deliveries back while orders and subsequent procurement plans remain intact, the issue is primarily one of timing. If customers scale back cluster deployments or competitors take orders, however, the impact could carry into the following year’s revenue base. Both scenarios depress current-period results, but they have very different implications for long-term earnings and valuation and cannot simply be explained away by citing the industry’s large long-term opportunity.
Profitability should be assessed alongside revenue. Goldman Sachs forecasts third- and fourth-quarter net profit of RMB 10.581 billion and RMB 16.2 billion, respectively, with gross margins of 46.6% and 47.2%. If revenue meets forecasts but profit falls short, the focus should shift to pricing, product mix, and costs. If both revenue and profit disappoint, shipment volumes, market share, and delivery execution should be examined first. This framework translates an earnings miss into specific operating variables.
VI. After Profit Expansion Comes the Cash-Flow Test
Rapid growth generally requires upfront funding. Goldman Sachs forecasts 2026 capital expenditure of RMB 9.73 billion for Zhongji Innolight, approximately 253% above 2025, with annual investment remaining at a similar level in 2027 and 2028. Beyond spending on plants and equipment, the company must build inventory, organize production, and wait for customer payments. The faster revenue grows, the greater the absolute capital tied up in inventories and receivables may become.
The cash-flow statement makes this constraint clear. For 2026, the report forecasts net profit of RMB 40.432 billion, operating cash flow of RMB 24.285 billion, and free cash flow after capital expenditure of RMB 14.555 billion. Operating cash flow would equal approximately 60% of net profit, while free cash flow would equal about 36%. Free cash flow measures the cash remaining from operations after capital investment; the figures and definition here follow the original report and do not treat accounting profit as immediately distributable cash.
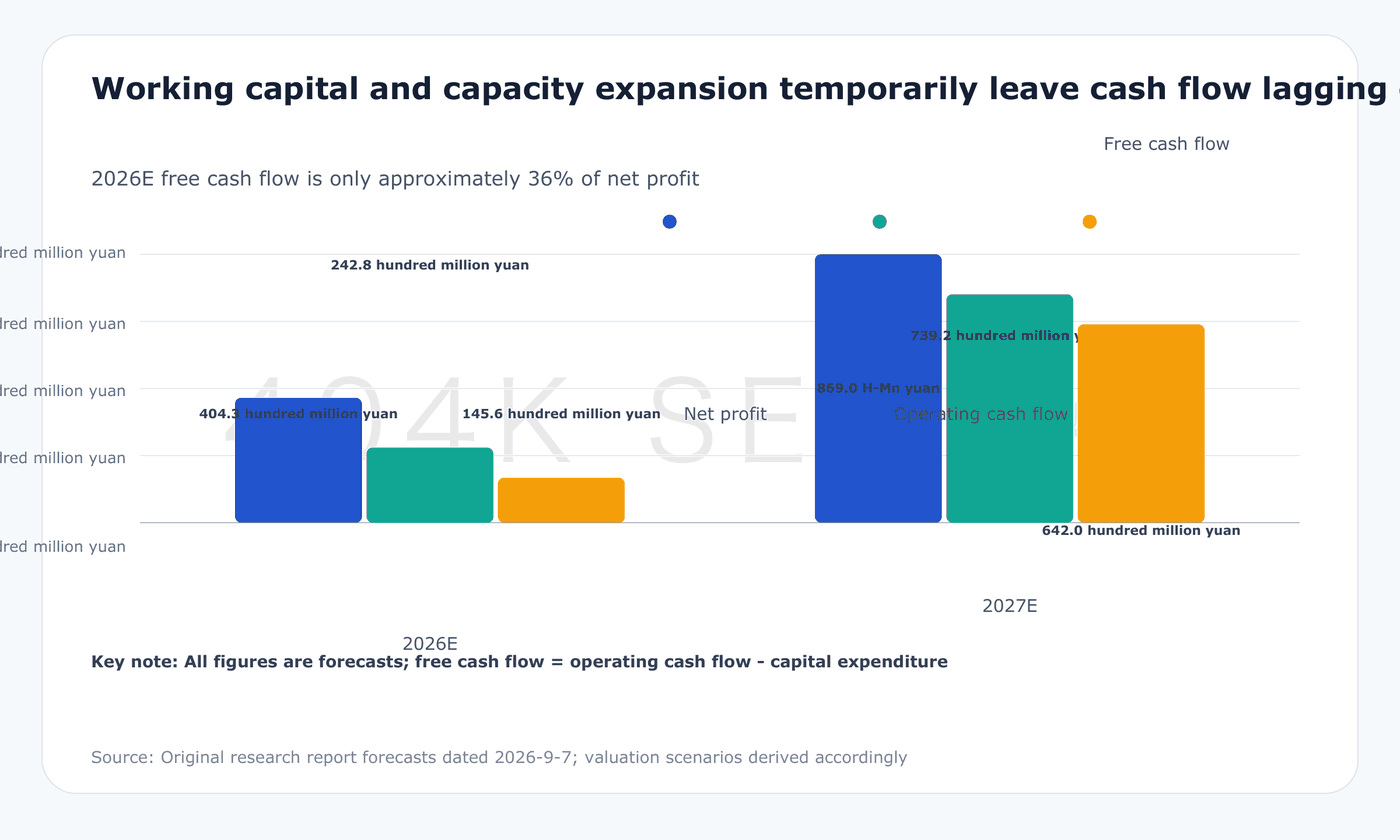
A major reason is the projected RMB 21.247 billion working-capital cash outflow in 2026. The company may already have recognized revenue while cash remains in customers’ accounts, or it may have invested in inventory ahead of delivery. The original report forecasts the cash conversion cycle falling from 122 days in 2025 to 82 days in 2026. This metric measures the time between deploying operating funds and recovering them. Such a substantial improvement in turnover is already embedded in the cash-flow forecast and should not be counted again as an incremental upside outside the model.
Stronger cash flow thereafter also depends on these turnover assumptions holding. The report forecasts free cash flow of RMB 64.195 billion in 2027, materially narrowing the gap with profit, although its balance-sheet projections still show higher receivables and inventories. If customer payments slow or inventory composition fails to keep pace with product transitions, capital tied up could exceed the model’s assumptions. Both turnover days and absolute balances should therefore be monitored; focusing on a single ratio can obscure the funding requirements created by scale expansion.
One further figure is easily misread: the report forecasts year-end 2026 cash of RMB 69.567 billion, but the cash-flow statement includes RMB 48.524 billion from changes in equity capital. The increase in cash therefore cannot be attributed entirely to internally generated cash from product sales. Financing can support expansion, but it is distinct from improved operating efficiency. When assessing per-share value, earnings, share count, and earnings per share must also be kept on a consistent basis.
VII. The RMB 2,645 Price Target Requires Both Earnings and Valuation to Hold
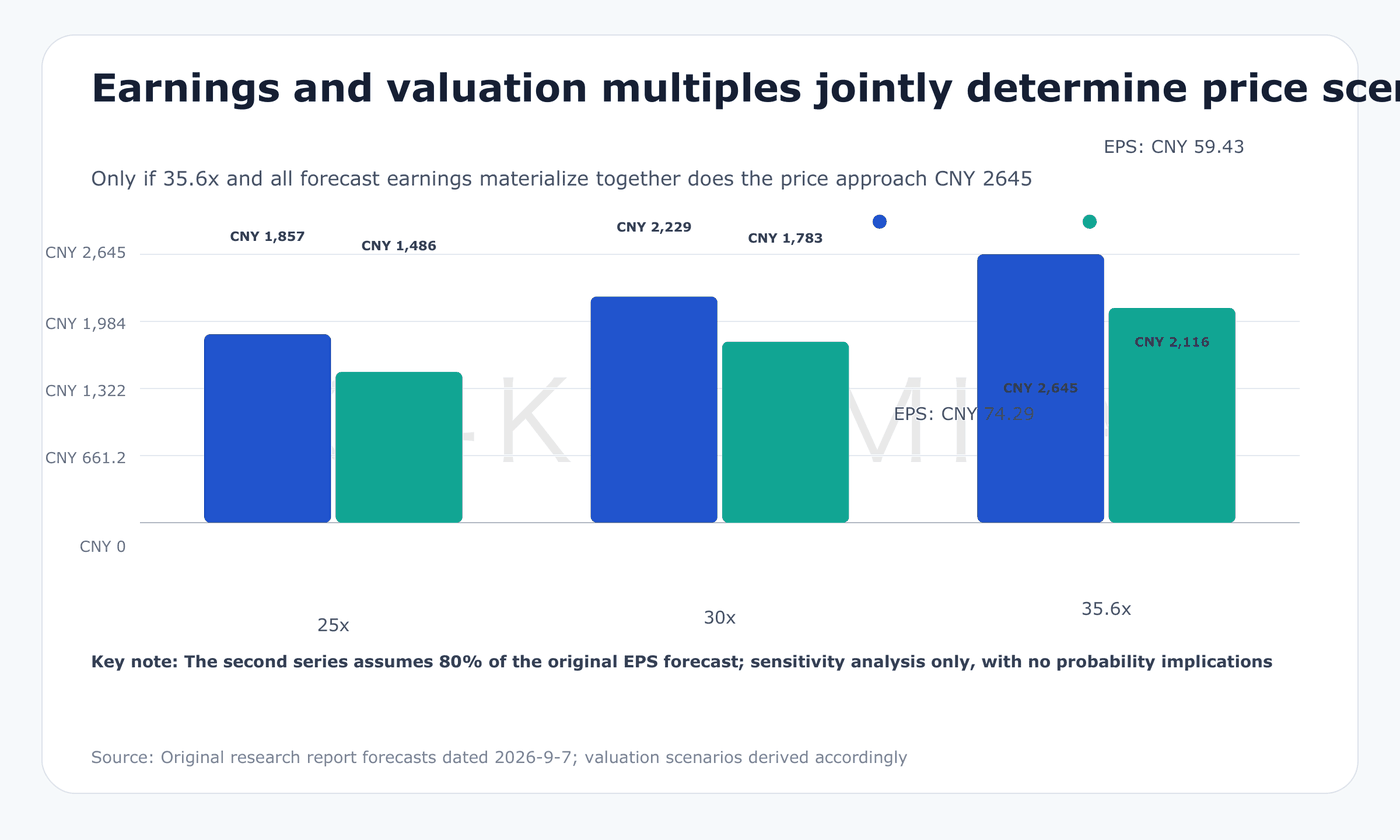
Goldman Sachs derives its A-share price target directly by multiplying forecast 2027 earnings per share of RMB 74.29 by a target P/E of 35.6x, producing approximately RMB 2,645. The P/E ratio represents the price the market is willing to pay for each yuan of annual earnings. The formula does not use 2026 EPS, nor can 2028 earnings replace the base year; doing so would double-count growth across different periods.
The 35.6x multiple is also conditional. Goldman Sachs examines peer valuations relative to the sum of next-year net-profit growth and operating margin, then derives the target multiple using Zhongji Innolight’s approximately 58% earnings growth and approximately 43% operating margin in 2028. This relative-valuation framework incorporates both growth and profitability, but it is not an immutable pricing rule. Changes in the peer group, industry risk appetite, or long-term forecasts could all alter the outcome.
Using the same RMB 74.29 EPS estimate, a 25x P/E implies approximately RMB 1,857, 30x implies approximately RMB 2,229, and 35.6x implies approximately RMB 2,645. If earnings reach only 80% of Goldman Sachs’ forecast while the P/E is 25x, the implied value is approximately RMB 1,486. The 25x, 30x, and 80% assumptions are sensitivity parameters selected by the author, not new price targets or assigned probabilities. Their purpose is to show that earnings misses and multiple compression can compound: strong corporate growth does not guarantee that the original price target will be realized.
The report also assigns the H shares a target price of HKD 3,267, applying a 13% H-over-A premium to the A-share valuation and an exchange rate of HKD 1 to RMB 0.9. The premium is based on the peer comparison selected in the report and is not a permanent rule. Nor should the two price targets be compared directly without accounting for their different currencies. The RMB 2,645 figure discussed here remains the original report’s A-share price target throughout.
The next set of evidence should be prioritized by proximity to revenue and cash generation. First, assess whether third- and fourth-quarter revenue can approach RMB 35.7 billion and RMB 54.4 billion, respectively, and whether gross margin continues to improve. Second, determine whether 1.6T and new businesses progress from qualification to volume deliveries. Third, monitor whether receivables, inventories, and free cash flow support the quality of reported earnings. If quarterly execution falls short, first revise the affected volume, pricing, or cost assumptions, and then determine whether the long-term forecast still holds.
The original report’s downside risks also include insufficient demand for high-speed optical modules, delays in new-product ramp-ups, market-share losses, shortages of upstream components such as EML and CW lasers and DSPs, and geopolitical risks. Any potential import restrictions remain subject to formal rules, their scope of application, and actual enforcement; the report itself does not assign a probability to such restrictions. Opportunities from technology upgrades may still materialize, while delivery execution, profit allocation across the value chain, or cross-border procurement could alter the returns captured by the company. Only as this operating evidence emerges can the elevated earnings forecasts and valuation multiple be supported simultaneously.