
Contents
Contents
1. Whose Money Is the RMB 8.5 Trillion, and Where Is It Spent?
2. A Gap Remains Between Triple Capacity and Triple Effective Compute
3. Domestic Chip Ramp Changes Both Supply and Cost Structure
4. Financing Can Support Buildout, but It Cannot Replace End Demand
5. Why Returns Differ Across Three Businesses Using the Same Server
6. Effective Throughput Is the Most Important Variable for Domestic Solutions
7. After Prices Fall, Growth Needs Stronger Usage Demand
8. Supply Chain Opportunities Must Be Segmented by Cash Flow and Bargaining Power
9. How to Judge Whether This Round of Investment Is Making Money
This content is compiled from publicly available information and research reports. It does not constitute investment advice or represent any individual's views. For educational reference only; please read critically.
China’s AI infrastructure is entering a large-scale expansion. But how much usable compute RMB 8.5 trillion of investment can build and how much profit it can generate are two different questions. Domestic chip supply determines the pace of buildout, while actual throughput and customer payments determine returns on capital.
Contents
1. Whose Money Is the RMB 8.5 Trillion, and Where Is It Spent?
2. A Gap Remains Between Triple Capacity and Triple Effective Compute
3. Domestic Chip Ramp Changes Both Supply and Cost Structure
4. Financing Can Support Buildout, but It Cannot Replace End Demand
5. Why Returns Differ Across Three Businesses Using the Same Server
6. Effective Throughput Is the Most Important Variable for Domestic Solutions
7. After Prices Fall, Growth Needs Stronger Usage Demand
8. Supply Chain Opportunities Must Be Segmented by Cash Flow and Bargaining Power
9. How to Judge Whether This Round of Investment Is Making Money
1. Whose Money Is the RMB 8.5 Trillion, and Where Is It Spent?
In a September 2026 forecast, Morgan Stanley estimated that relevant Chinese entities would invest cumulatively about RMB 8.5 trillion in 2026–2030, driving AI infrastructure expansion. This is a five-year forecast and includes construction spending by Chinese companies overseas. Treating it as a single-year budget, fully committed orders, or entirely domestic capital would overstate the strength of demand.
The investment comes mainly from three types of entities. Large cloud providers are expected to invest about RMB 6.3 trillion, roughly three-quarters of the total; new compute-cloud providers about RMB 1.5 trillion; and telecom operators about RMB 653 billion in compute-related capex. These sum to RMB 8.453 trillion, or roughly RMB 8.5 trillion. The spending center of gravity remains large cloud providers with customers, cash flow, and platform capabilities. Specialist compute service providers supplement this, while operators add compute investment on top of existing network and government-enterprise businesses.
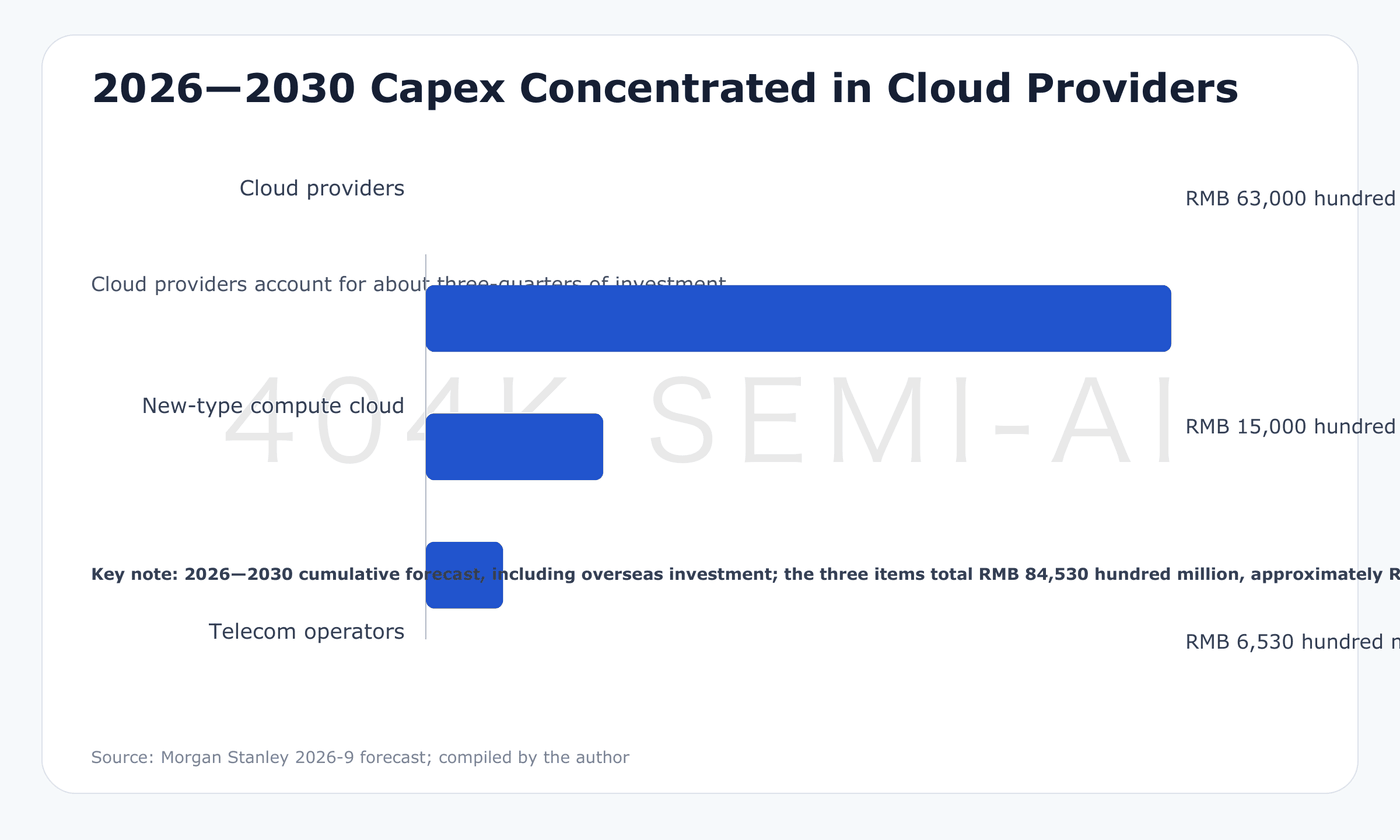
These three investment pools cannot be mechanically mapped to three independent sources of end demand. A cloud provider may rent servers from a specialist compute service provider and then offer cloud services to its own customers. The customer’s rent becomes the service provider’s revenue, and the service provider uses that revenue plus financing to buy equipment. The same demand chain can simultaneously contain capex, prepayments, lease contracts, and long-term procurement commitments. When analyzing market size, one must distinguish equipment purchases, funding arrangements, and service revenue to avoid double-counting the same underlying demand.
By time distribution, Morgan Stanley expects total annual capex to rise from about RMB 1.3 trillion in 2026 to about RMB 2 trillion in 2030. Using these approximations, the compound growth rate over four annual intervals is about 11%. That is different from the intuitive feel of “RMB 8.5 trillion over five years”: it implies continuous expansion on a large base, not a doubling of spending every year. Whether equipment suppliers can sustain high growth also depends on domestic substitution share, product value, and order recognition timing.
Geography matters as well. Domestic investment is about RMB 6.4 trillion and overseas investment about RMB 2 trillion, with components and totals rounded. Overseas buildout involves different equipment choices, funding sources, and operating arrangements. One cannot divide all RMB 8.5 trillion by domestic capacity additions to directly calculate domestic unit construction cost. Nor is the roughly RMB 2 trillion of overseas spending an equal-sized external financing gap; companies can still use cash, operating cash flow, or proceeds from selling investment assets.
Some original estimates have text-chart discrepancies. For example, new compute-cloud spending in 2026 appears as both RMB 234 billion and RMB 324 billion; RMB 234 billion is more consistent with the detailed estimate and total. Certain operator chart units are also inconsistent with the text. These data are therefore better used to understand funding scale, entity structure, and growth direction, not as precisely confirmed procurement budgets for every annual split.
2. A Gap Remains Between Triple Capacity and Triple Effective Compute
Morgan Stanley expects China’s domestic IT power capacity to rise from 26 GW in 2025 to 81 GW in 2030, about 3.12x and a net increase of 55 GW. Cloud providers contribute 34 GW, operators 9 GW, and other participants 12 GW. The operator leasing portion has been de-duplicated in the model, while “other” includes a residual estimate; the evidence precision of the three increments is not uniform.
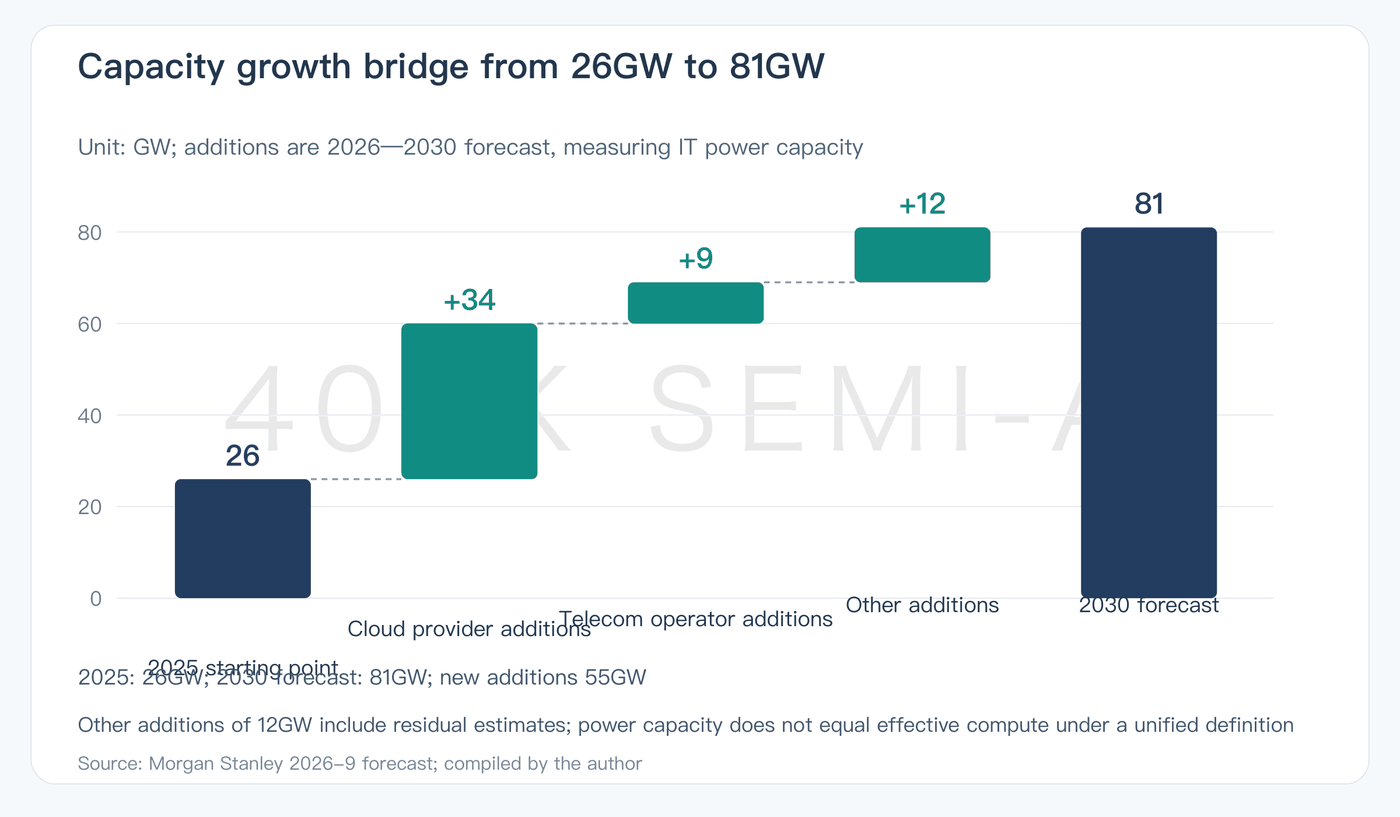
GW measures the electricity capacity of IT equipment, not a standardized measure of compute performance. Different GPUs, specialized chips, and CPUs can complete very different training or inference workloads while consuming the same unit of power. Even with identical hardware, networking, software adaptation, task scheduling, and idle time can change the effective compute ultimately produced. 81 GW does not correspond to a fixed token output, and even less does it directly mean a threefold increase in model capability.
Understanding this forecast therefore requires at least three layers: how many devices a facility can host, how many compute tasks those devices can complete, and how many tasks customers pay for. The first can be observed through data center capacity; the second depends on throughput and service quality under real workloads; the third ultimately shows up in revenue and cash flow. Capacity buildout occurs first, while paid demand and economic returns may not arrive in sync.
Supply is not only domestic. Morgan Stanley expects Chinese cloud providers to add about 47 GW of global capacity in 2026–2030, including 34 GW domestically and 13 GW overseas. Global and domestic figures cannot be mixed. For the earlier 2026–2028 period, Chinese cloud providers’ global additions are forecast at 24 GW, versus 108 GW for the US. This same-period comparison suggests China is expanding quickly, but does not automatically mean its absolute additions are approaching America’s; different equipment mixes also limit how directly GW can be used to compare technical capability.
For third-party data centers, order growth is a more direct operating variable. Morgan Stanley expects relevant annual orders to rise from 6.1 GW in 2026 to 11 GW in 2030, with five-year demand of about 33 GW in the west and 14 GW in the east. The larger western scale means power and construction costs carry weight in site selection, but orders do not equal commissioned capacity, still less customers already paying rent.
This time lag affects project returns. If model companies delay equipment delivery or business launch, built data centers still bear capital costs. Morgan Stanley’s project analysis notes that customer racking delays of 6–12 months can significantly lower unlevered internal rates of return on data center projects. For IDC companies, judging growth quality requires observing signing, delivery, racking, and collection together; looking only at announced GW additions misses the phase with the heaviest capital occupation.
3. Domestic Chip Ramp Changes Both Supply and Cost Structure
A key assumption supporting capacity expansion is a significant increase in domestic AI chip supply. Morgan Stanley forecasts domestic AI chip shipments rising from 1.1 million units in 2025 to 2.4 million in 2026, 4.8 million in 2027, and 11 million in 2030. Volume grows roughly tenfold from 2025 to 2030, while the corresponding market size rises from RMB 94 billion to RMB 646 billion.
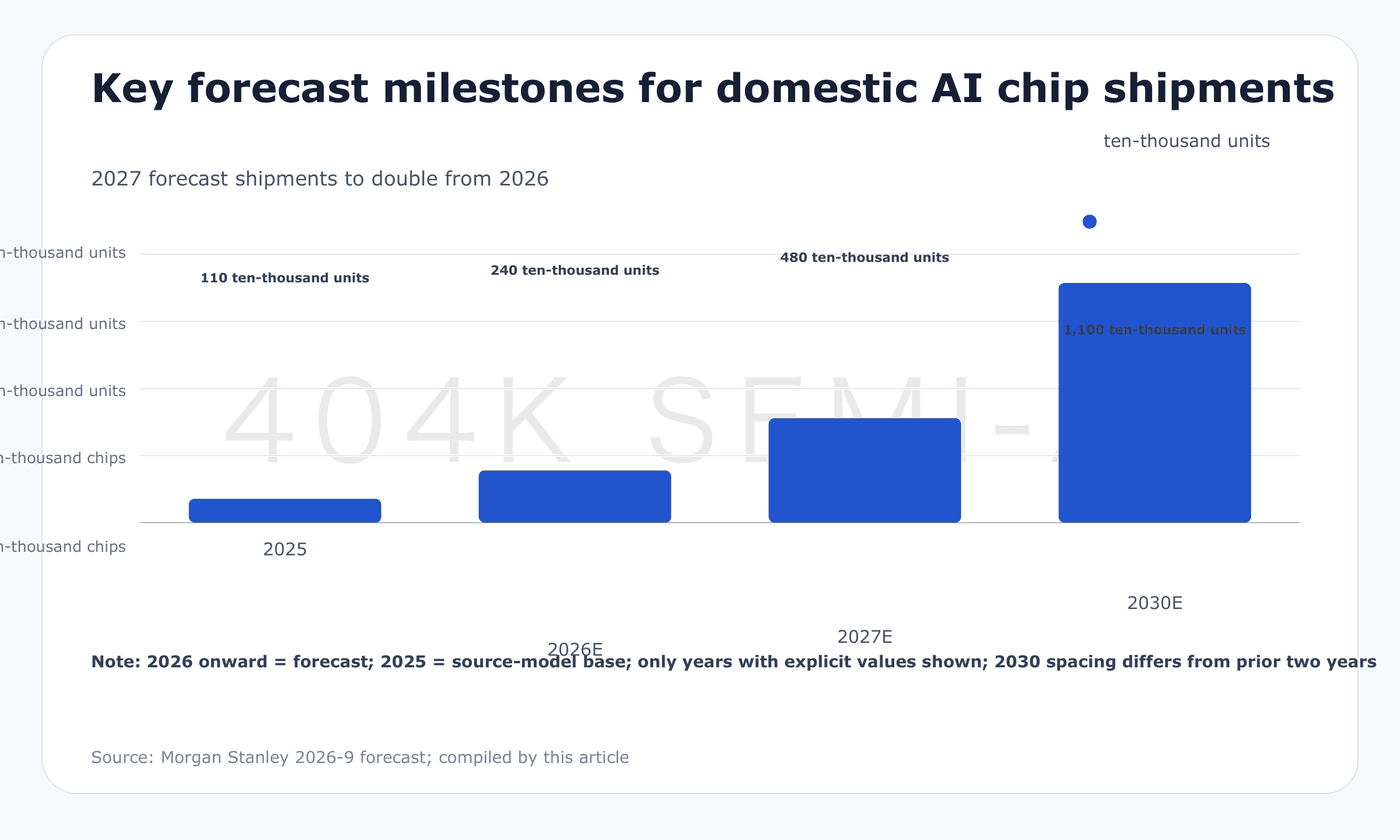
Shipment growth outpacing market value growth is a difference worth unpacking. Based on the approximations above, market value per unit falls from about RMB 85,500 to about RMB 58,700. This is only an implied average under different years’ product mixes and should not be read as the same chip model becoming about 30% cheaper. Product structure, chip category, and statistical scope can all affect the result, but it at least reminds investors that a tenfold increase in chip volume does not mean supplier revenue and profit grow by the same multiple.
