
Contents
1. Compute Upgrades Push Power-Delivery Pressure onto Tiny Capacitors
2. Where Does the 166% Increase in Rack Value Come From?
3. High-End Supply Bottlenecks: Materials, Yield, and Qualification
4. In the Same Demand Cycle, Four Suppliers Earn Different Profits
Profit Drivers for the Four Suppliers Each Have Conditions
5. Yageo's Earnings Leverage Must Cut Through Restocking Noise
6. The Long-Term Market Is Large, but Forecasts Are Not Certain Capacity
Two Forecast Paths Imply Different Growth Magnitudes
7. Earnings Upgrades and Target-Price Cuts Can Coexist
8. What Specific Questions Must the Next Round of Results Answer?
This content is compiled from publicly available information and research reports. It does not constitute investment advice or represent any individual's views. For educational reference only; please read critically.
AI servers are changing the MLCC demand structure: more capacitors, higher capacitance, and smaller footprints are appearing at once, lifting value per server. But how much of that demand growth becomes profit depends on high-end manufacturing capability, customer inventories, and the pace of capacity expansion. The gap between suppliers may keep widening.
1. Compute Upgrades Push Power-Delivery Pressure onto Tiny Capacitors
Multilayer ceramic capacitors, or MLCCs, are basic components for energy storage, filtering, and decoupling in electronic devices. Their profile is far lower than that of GPUs, but they directly help stabilize power delivery near chips. When a GPU switches at high speed under low voltage, current demand changes rapidly; capacitors placed close to the chip must supply short bursts of current while suppressing voltage fluctuations and high-frequency noise.
Compute platform upgrades are imposing two simultaneous requirements on these components: capacitance must increase, but mounting space cannot expand proportionally. New demand is therefore concentrating in smaller, higher-capacitance products. Being able to mount the component on a board is only the first step; delivering sufficient electrical performance within a constrained footprint while maintaining mass-production consistency determines whether a supplier can win high-value orders.
In its September 2026 forecast, Morgan Stanley listed key specifications needed for the VR200 platform: 1608-size 100µF, 1005-size 47µF, and 0603-size 10µF parts. These are metric size codes; 1608 is roughly 1.6 mm by 0.8 mm. Size and capacitance must be considered together: the same 100µF part, if it can be built into a smaller package, may face materially higher manufacturing difficulty and carry materially higher commercial value.
Morgan Stanley estimates that 1608-size, 100µF parts can command 5-10x the price of the larger or lower-capacitance parts used for comparison. That gap shows that rising high-end demand first changes the sales mix. Producing more ordinary capacitors cannot automatically substitute for small, high-capacitance products; ample total industry capacity does not mean supply is loose for the specifications AI customers need.
2. Where Does the 166% Increase in Rack Value Come From?
Morgan Stanley's estimates for GB300 NVL72 and VR200 NVL72 racks provide a direct way to break down demand: the former uses 319,500 MLCCs worth $4,664; the latter uses 571,050 worth $12,411. These are analyst whole-rack bill-of-materials assumptions, not confirmed purchase orders.
On these inputs, unit count rises 78.7% and rack value rises 166.1%. Dividing value by count implies average value per unit rises about 48.9%. The relationship is: 1.787x the units times about 1.489x average value equals about 2.661x rack value. The change in average value includes shifts in specifications, board structure, and product mix; it should not be treated as a pure price increase for an identical specification.
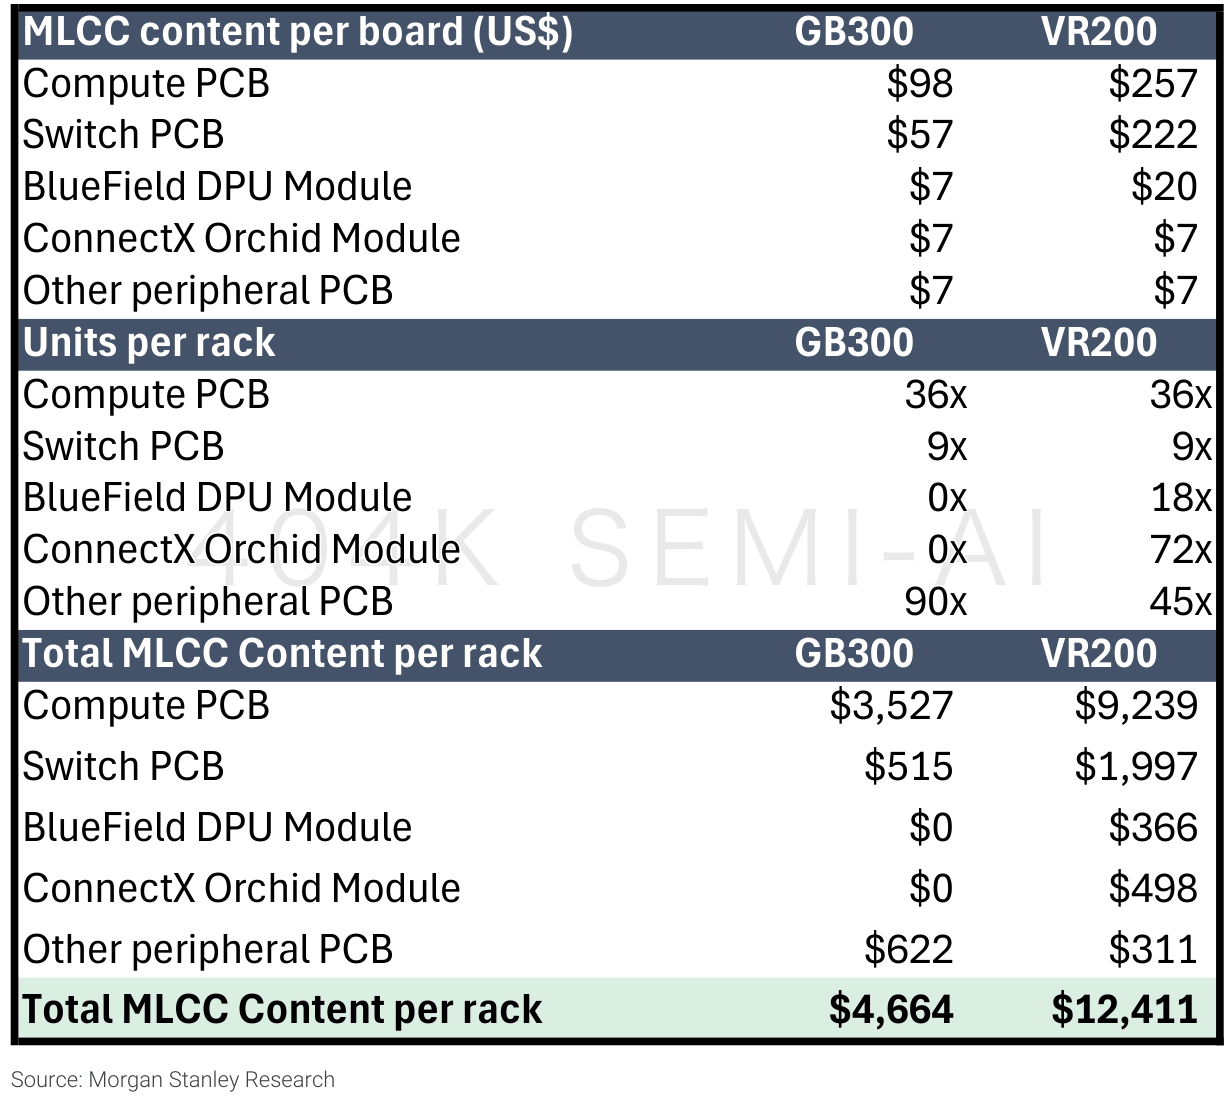
The increment comes mainly from compute boards and switch boards. Per Morgan Stanley's breakdown, MLCC value on compute boards per rack rises from $3,527 to $9,239, while switch boards rise from $515 to $1,997. Compute boards contribute about 74% of the rack value increment. New modules also contribute, but the main change still occurs in core compute and interconnect.
This supports a more useful revenue-analysis sequence: first, how many racks the customer actually delivers; second, how many capacitors each rack requires; and third, what proportion of those are high-value specifications. Extrapolating MLCC revenue only from AI server shipment growth misses mix upgrade. Seeing a large increase in per-rack value while ignoring rack deployment delays overstates the speed of revenue realization.
