
Contents
Weekly Thesis
AI Silicon, Advanced Packaging, and Servers
Optical Communications, CPO, PCBs, and High-Speed Interconnects
Data Center Cooling, Power, and Grid Infrastructure
Robotics, Edge AI, and Hardware Applications
Space, Quantum Computing, and AI Software Applications
Debates, Counter-Evidence, and Forward Catalysts
AI infrastructure demand is expanding from discrete GPU procurement to fully operational, turnkey systems. Autonomous agents are driving sharp increases in CPU and storage consumption, while interconnect, liquid cooling, and power infrastructure compete for a growing share of total budgets. Investment priority should center on physical delivery and cash conversion. The primary sector risk is a simultaneous downstream pricing war and upstream component inflation, compressing the returns of compute purchasers.
Weekly Thesis
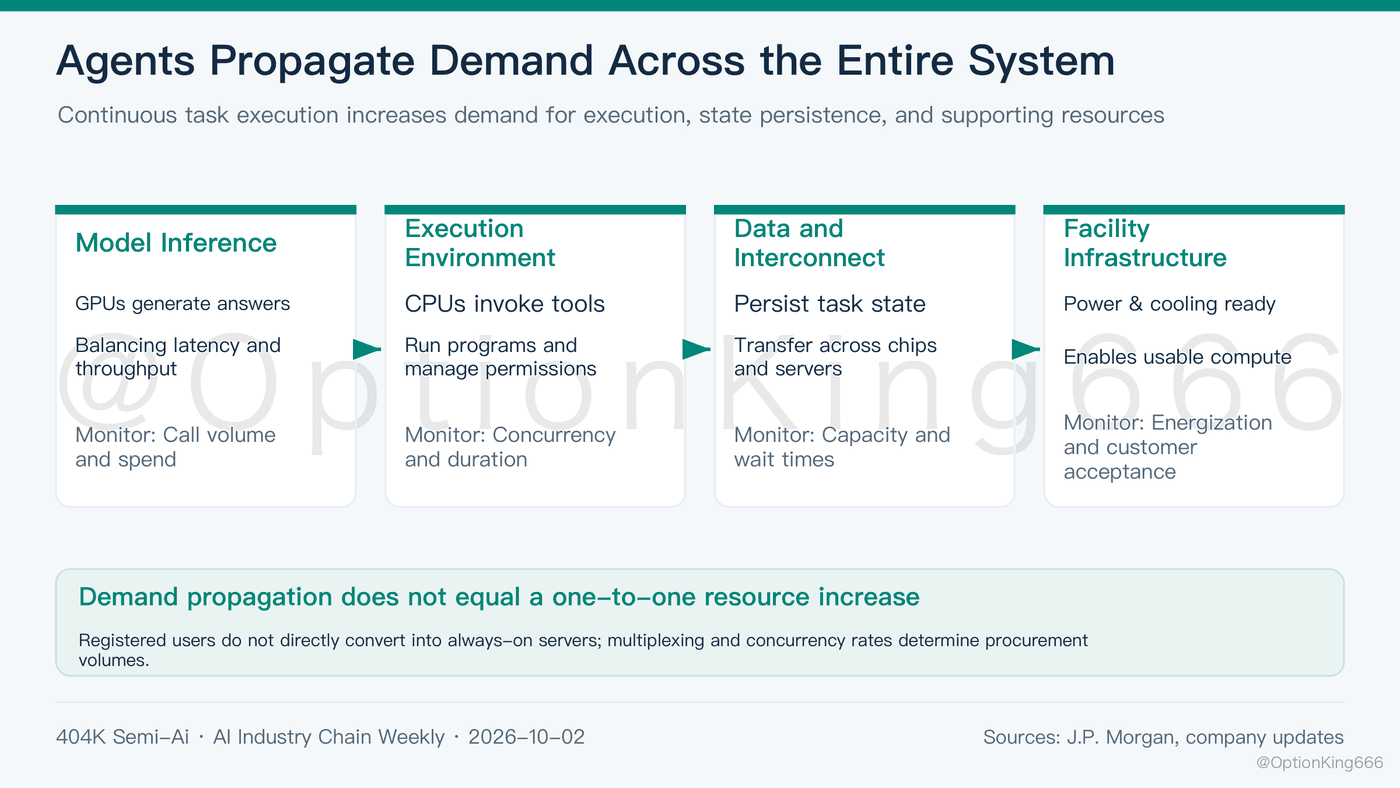
The most significant structural development this week is that surging compute demand is simultaneously pulling compute, execution, and facility infrastructure. JP Morgan observed that OpenRouter platform API call volume jumped 71% MoM in September, while weighted ASP declined 25%, leaving total spending up 28%. Price cuts have stimulated volume, but top-line revenue is not scaling 1:1 with token consumption. For the supply chain, workload volume determines hardware utilization, while dollar spending dictates whether customers can sustain ongoing capital outlays; both must be evaluated together.
Workloads are also restructuring server bill-of-materials (BOM). While model inference requires GPUs, persistent agentic execution demands CPUs to execute code, query databases, govern permissions, and maintain execution state. Wiwynn's general-purpose server demand model, Meta's sandbox architectures, and NVIDIA's Vera deployments all point to the same structural inflection: AI capital budgets are purchasing complete end-to-end workflows. Investors should avoid linearly mapping every registered user to an always-on dedicated server; concurrency ratios, session duration, and resource virtualization will dictate actual hardware procurement.
This phase favors suppliers that solve concrete physical delivery bottlenecks. Turnkey servers delivered on schedule, lower-latency networking, proven thermal dissipation, and energized utility interconnects convert into realized revenue far faster than speculative capacity expansions. Conversely, debottlenecking one node often exposes the next constraint sooner. Investment decisions must follow system commissioning, not raw silicon order backlogs.
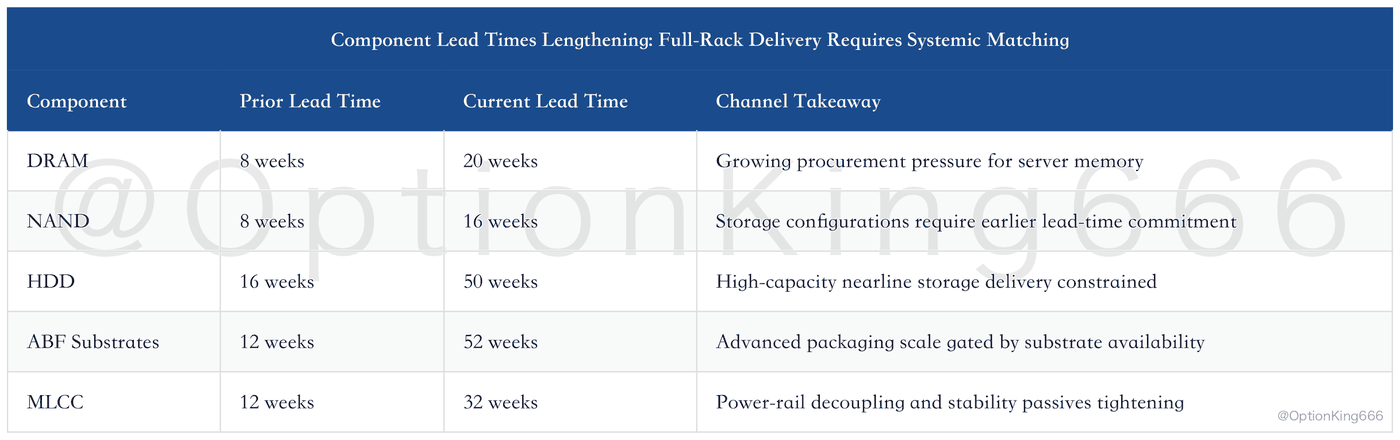
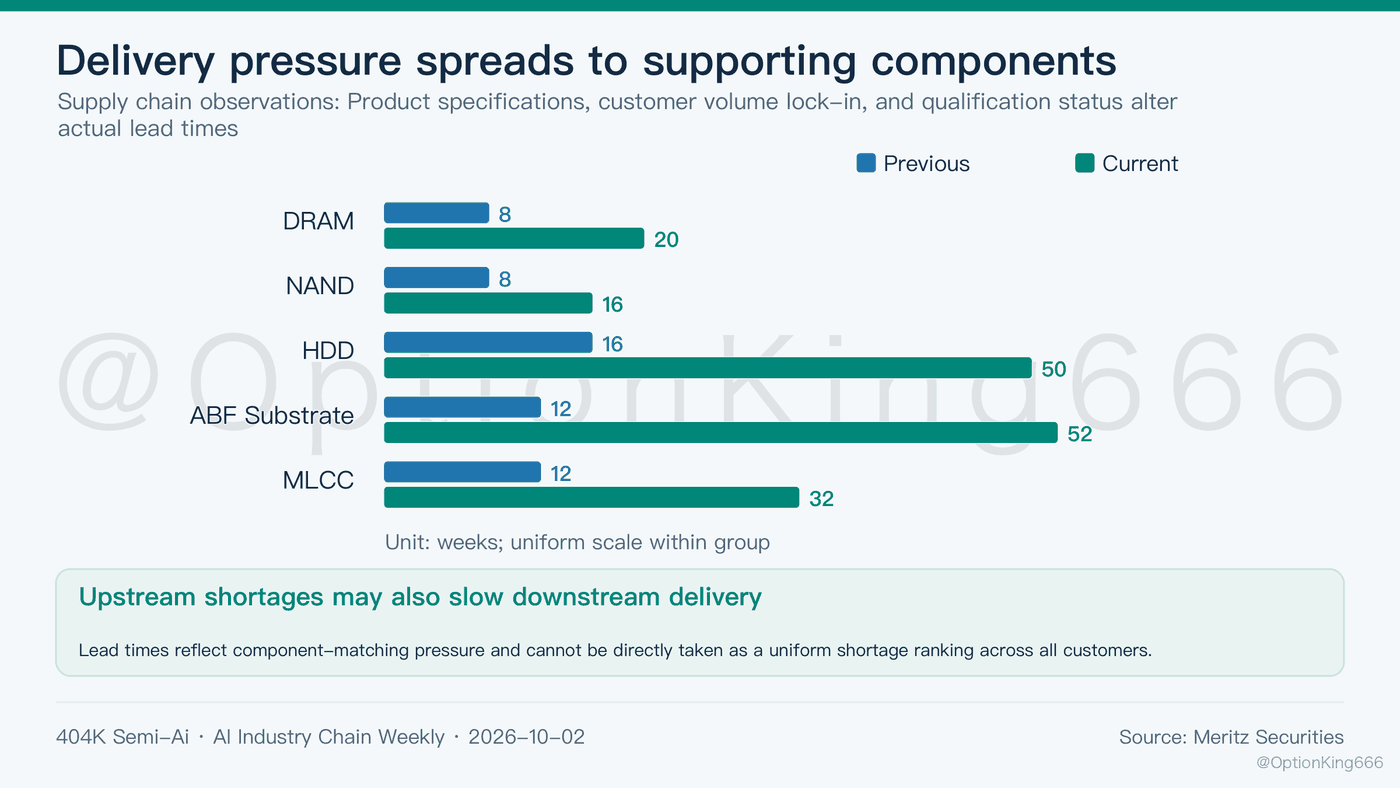
Supply constraints have cascaded into IC substrates, memory, and passive components. However, lead-time extensions across tiers cannot be directly equated to uniform shortages. Meritz Securities channel checks indicate lengthening lead times across multiple auxiliary components; these observations reflect specific supply-chain dynamics and vary depending on whether customers have locked in volume, product specifications, and qualification status.
Investors must separate price appreciation from volume shipment growth. Memory price hikes lift memory vendor revenues but inflate server build costs. Substrate shortages protect supplier pricing power but threaten customer system acceptance. When top-line expansion is driven primarily by ASP inflation, whether incremental cash flow covers ongoing capex is paramount. Upstream shortages and downstream delivery decelerations frequently coincide; supplier revenue projections across tiers cannot be naively aggregated.
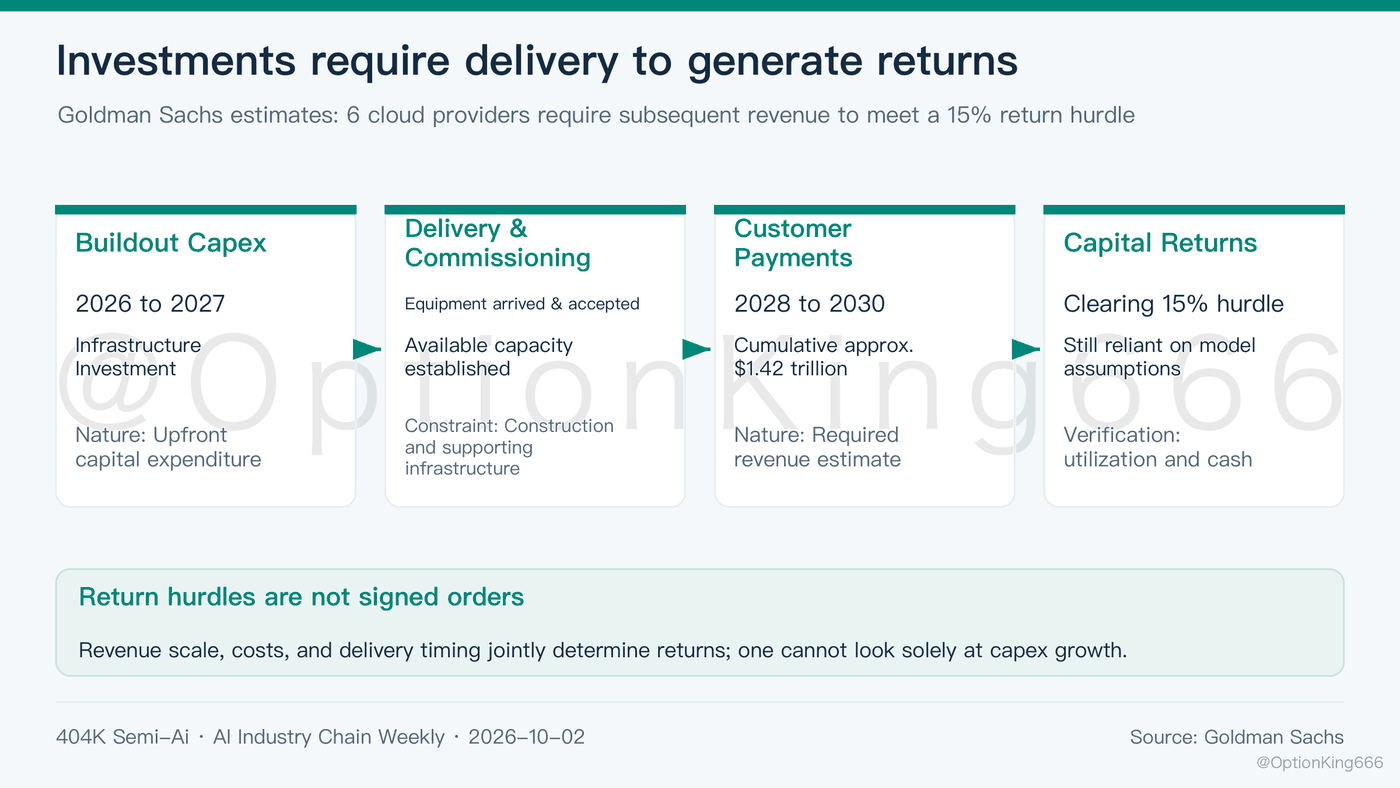
Industry return hurdles are becoming increasingly stringent. Goldman Sachs models that across six major hyperscalers, achieving a 15% ROIC on 2026–2027 infrastructure investments will require generating approximately $1.42 trillion in cumulative revenue across 2028–2030. This represents a conditional hurdle rate, not a contracted order backlog or a baseline annual forecast. The pivotal question is how much actual economic work enterprise end-users are willing to fund.
Microsoft provides a comparatively constructive case. JP Morgan estimates Microsoft's cloud ROIC will stabilize at 32%–33% across FY2027–FY2031 following initial front-loaded dilution, supported by CPU/GPU resource multiplexing and high-margin enterprise software subscriptions layered on top of infrastructure. Google faces steeper capital intensity: the same broker projects Google's 2027 capex reaching $378 billion, resulting in negative free cash flow of -$115 billion. Capex growth alone does not dictate quality; monetization architecture and revenue durability must be evaluated alongside spending.
Consequently, the core investment thesis continues to favor AI supply chain players backed by committed orders and integrated delivery capabilities, but company selection demands greater discipline. Component suppliers collecting cash upon delivery carry a vastly different risk profile from operators leveraging balance sheets to build facilities in anticipation of rental income. Long-term TAM explains corporate investment incentives, but only customer acceptance, fleet utilization, and cash realization generate true shareholder value.
AI Silicon, Advanced Packaging, and Servers
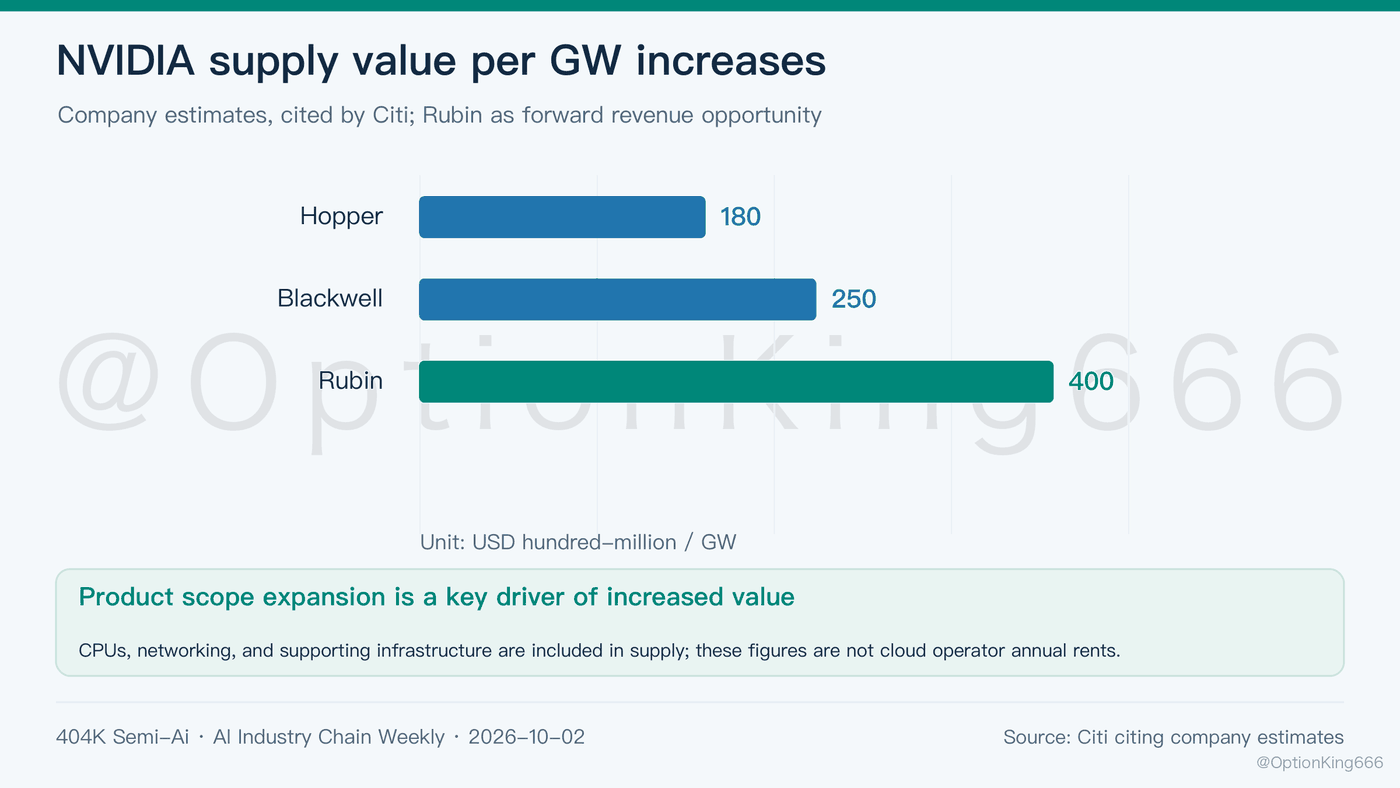
NVIDIA's growth thesis is evolving from discrete GPU shipments to total addressable revenue per gigawatt (GW) of data center power capacity. Citi cites company estimates showing that addressable revenue per GW increases progressively across Hopper, Blackwell, and Rubin architectures. Bundling proprietary CPUs, networking fabrics, and infrastructure subsystems drives this content expansion. Note that these metrics represent the vendor's equipment opportunity per site, not recurring annual cloud rental revenue.
NVIDIA System Scope Expansion: Revenue Opportunity per GW Scales Across Generations

Turnkey full-stack architectures also introduce operational delivery friction. NVIDIA's incorporation of agentic runtime environments and security monitoring into its platform helps lower enterprise deployment friction, but should not be directly modeled as immediate incremental hardware revenue. Security adoption and compatibility with legacy enterprise identity frameworks require real-world validation. Competitors that achieve superior TCO and faster delivery on specific workloads can still secure design wins.
Evaluating ultra-low-latency inference requires balancing throughput against unit cost. Reducing batch sizes improves GPU responsiveness but sacrifices aggregate throughput. Cerebras's low-latency architecture and traditional GPU general-purpose processing suit distinct workload profiles; hybrid inference deployments incur orchestration, data-transit, and idle-capacity overhead. Customers ultimately procure task completion per dollar; isolated demonstration speed is insufficient proof of broad-based displacement.
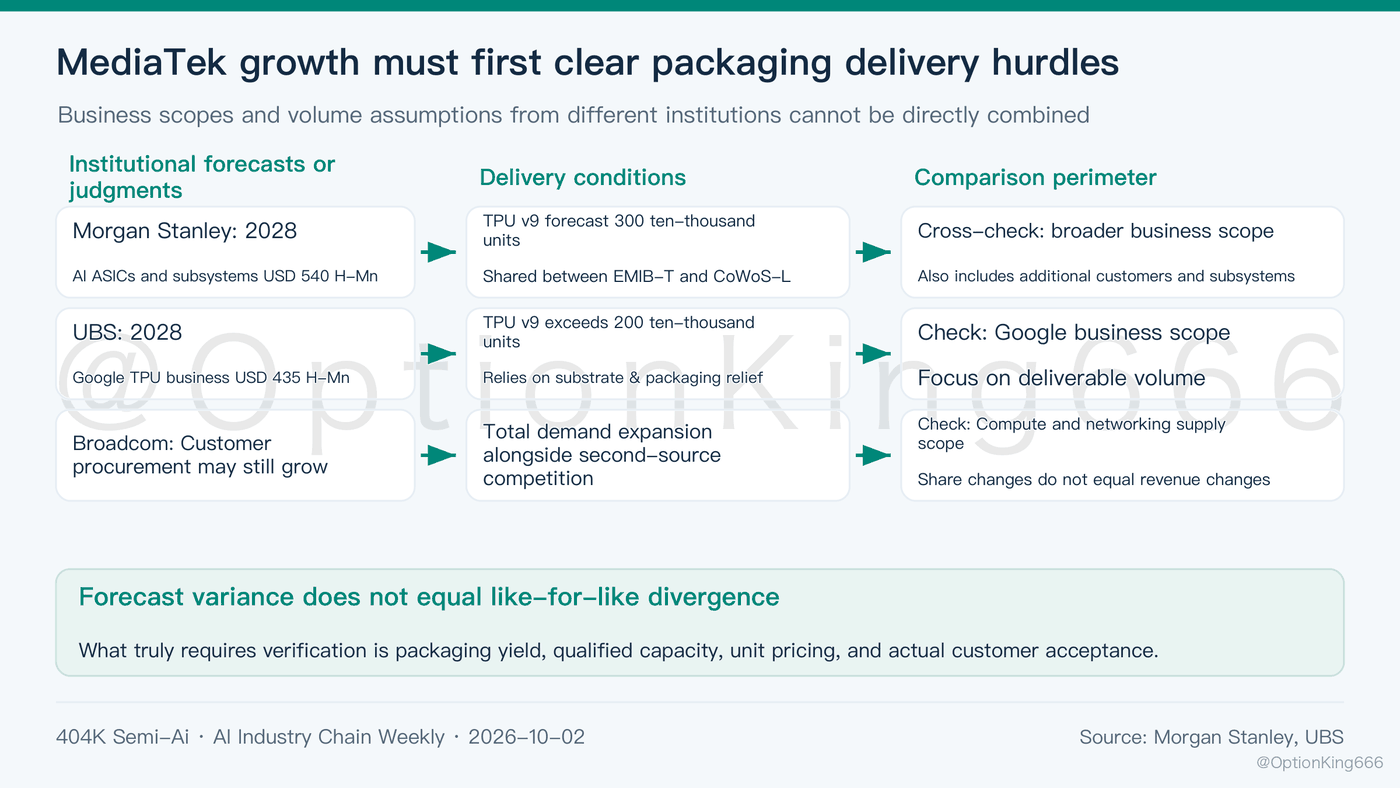
Custom ASIC momentum is reshaping supply-chain revenue profiles, yet MediaTek's forward forecasts remain heavily tethered to packaging allocations. Morgan Stanley projects MediaTek's 2028 AI ASIC and subsystem revenue at $54 billion, while UBS forecasts its Google TPU revenue at $43.5 billion in the same year. The former incorporates additional enterprise ASIC programs and board-level subsystems, whereas the latter reflects Google TPU business alone; this delta does not represent an institutional consensus clash over an identical revenue stream.
The meaningful comparison lies in TPU v9 volume and advanced packaging assumptions. Morgan Stanley assumes 3.0 million units, with Intel EMIB-T supplying 2.5 million and TSMC CoWoS-L providing 500,000. UBS estimates that substrate availability could support over 2.0 million units. Both houses are bullish on custom silicon ramps, but diverge on deliverable scale and backend packaging headroom. Citi highlights that an extended lifecycle for TPU v8 alongside v9 ASP increases can buffer intermediate delivery volatility.
Broadcom faces secondary-source competition, but stands to benefit from total customer infrastructure expansion. Assessing whether Broadcom's top line suffers requires analyzing aggregate customer deployment scale, Broadcom's retained compute and networking content, and project shipment pacing. MediaTek gaining ASIC share does not automatically translate into a net revenue decline for Broadcom; similarly, forward customer demand indications do not ensure that both vendors will recognize planned revenues concurrently.
Leading-edge foundry expansions are substantial, yet deliverable capacity depends on the synchronized readiness of cleanrooms, lithography tools, advanced packaging, and automated test. UBS lifted its TSMC 2027 and 2028 capex forecasts to $90 billion and $105 billion, projecting high-performance computing (HPC) will account for 74% of revenue by 2027. These figures represent sell-side modeling driven by higher demand assumptions rather than formally committed company budgets.
Memory procurement reveals more explicit customer capital constraints. Micron disclosed $32 billion in customer financial commitments, having collected $12.3 billion in customer deposits during its fiscal fourth quarter. Customer prepayments reinforce forward visibility, but do not convert immediately into recognized revenue. New advanced packaging cleanrooms require tool move-in, recipe tuning, and qualification; newly constructed footprint cannot be equated with immediate effective shipping capacity.
Micron's earnings also underscore that AI memory demand extends well beyond High Bandwidth Memory (HBM). The company reported Q4 FY2026 revenue of $54.23 billion, including $18.00 billion from Core Data Center and $16.28 billion from Cloud Storage. Business unit revenue cannot be equated with any single silicon category; server DRAM modules and enterprise SSDs for AI training clusters require granular, product-level tracking.
Domestic packaging players face parallel operational constraints. Citi notes that while JCET is accelerating advanced packaging capital expenditures, high-end AI silicon packaging throughput remains gated by upstream HBM supply. Tool purchase orders precede finished assembly revenue and do not guarantee simultaneous gross margin expansion. For OSAT vendors, capacity utilization, assembly yields, and customer sign-offs provide greater explanatory power for operating earnings than headline capex announcements.
