
目录
Key Weekly Takeaways
Front-End Wafer Fab Equipment
Metrology, Inspection, and Testing
Advanced Packaging Equipment and Critical Materials
Company Fundamentals, Order Books, and Capex Validation
Market Debates, Falsification Triggers, and Catalysts to Watch
The clearest shift across the semiconductor equipment supply chain this week is a broad pull-forward in procurement expectations, marked by upward revisions to wafer fab equipment (WFE) forecasts and stepped-up commitments in DRAM and advanced packaging. The most common pitfall in this rally is mistaking long-term capex plans for recognized revenue; the focus next week should be on equipment lead times, packaging yields, and test order conversions.
Key Weekly Takeaways
Equipment industry dynamics are transitioning from "willingness to expand capacity" to "early resource-locking," though monetization timelines will diverge across sub-sectors. Front-end wafer fab equipment (WFE) already shows tangible evidence of budget hikes, greenfield project additions, and expanding tool purchase lists. Meanwhile, advanced packaging and testing must navigate rising process complexity and tighter yield-control challenges. While extended order visibility is constructive, delivery schedules and customer acceptance criteria will ultimately determine quarterly revenue recognition.
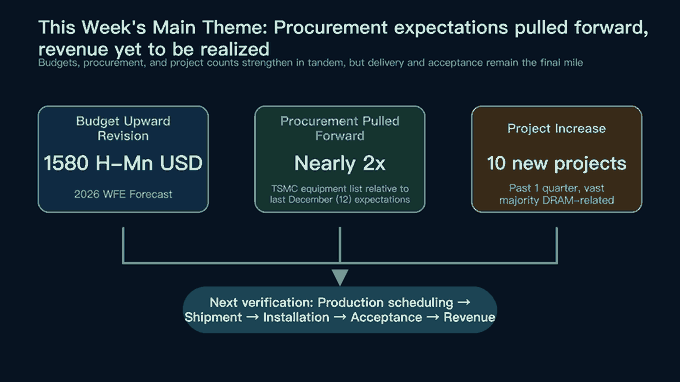
Three reinforcing data points emerged this week. First, UBS raised its 2026–2028 WFE forecasts. Second, media reports indicate that TSMC's current equipment procurement list is nearly double its December 2025 baseline. Third, among 10 new fab projects observed by Applied Materials in the most recent quarter, the vast majority were DRAM-related. The first two points signal upward budget revisions and accelerating procurement schedules, while the third highlights that incremental demand is concentrated in memory and advanced packaging rather than distributed evenly across all tool categories.

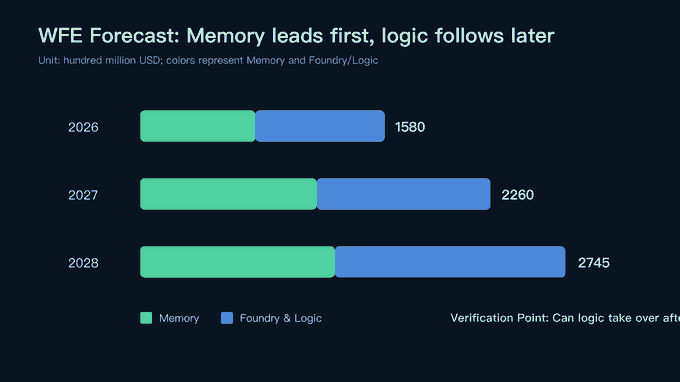
UBS raised its 2026 WFE forecast from $147.0 billion to $158.0 billion, lifting the projected YoY growth rate from 27% to 36%.
The 2027 forecast was revised up from $198.0 billion to $226.0 billion, and 2028 was raised from $247.5 billion to $274.5 billion.
The implication of this model is straightforward: 2026–2027 growth will be front-loaded with DRAM and NAND equipment orders, whereas the acceleration slope in foundry and logic will not become prominent until 2H27 and beyond. It also poses a critical counter-risk: if memory capex plateaus post-2027, the sustained growth baton for equipment vendors will hinge entirely on whether logic customers execute their planned expansions on schedule.
Headline forecasts must be disaggregated by tool category. Rising DRAM capex disproportionately benefits deposition, etch, wet clean, metrology, and fab facility infrastructure. In contrast, advanced logic node expansion drives higher intensity in lithography, process control, and multiple patterning tools. Even under an identical headline WFE figure, a customer pivot from greenfield construction to brownfield line upgrades significantly alters vendor product mix, tool installation timelines, and revenue recognition schedules. While aggregate industry figures gauge top-line sector buoyancy, tool order composition dictates individual company operating leverage.
The current model pegs 2026 memory WFE at $74.5 billion, comprising ~$56.0 billion for DRAM and ~$18.5 billion for NAND. DRAM spending is roughly 3x that of NAND, explaining why Applied Materials' new fab opportunities are overwhelmingly skewed toward DRAM.
By 2028, foundry and logic spending is projected to reach $148.8 billion, surpassing memory's $125.8 billion. Equipment suppliers leveraged exclusively to memory could face challenging high-base comparables post-2027, whereas vendors with balanced exposure across advanced logic nodes are better positioned for a seamless multi-year revenue handoff.
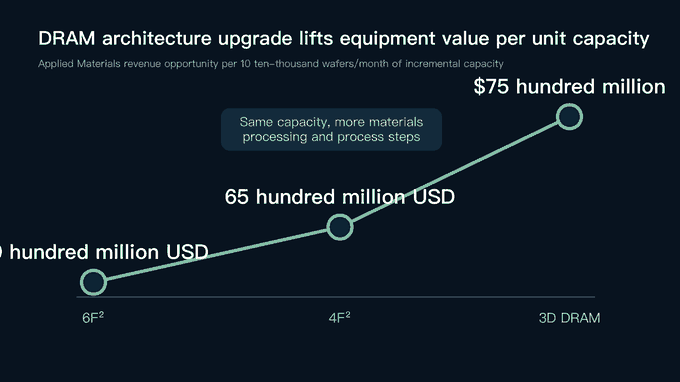
Applied Materials' served revenue opportunity per unit capacity illustrates the tool capital intensity inflation: for every 100k wpm of incremental capacity, the company's SAM expands from ~$6.0 billion in 6F² DRAM, to ~$6.5 billion in 4F², and reaches ~$7.5 billion in 3D DRAM. This incremental value is driven by additional steps in epitaxial deposition, conductor etch, interconnect metallization, and adjacent processing. Consequently, architectural transitions drive significant equipment dollar growth even at flat wafer capacity additions.
The transition from 6F² to 3D DRAM represents a ~$1.5 billion (~25%) increase in served revenue opportunity per 100k wpm. This growth does not require customers to expand monthly wafer output by 25%; it materializes purely from higher materials processing intensity and additional critical process steps along the technology roadmap. Conversely, if customers absorb architectural complexity through higher tool utilization or process streamlining, actual equipment billings could fall short of these static models. Moving forward, these theoretical unit capital intensities must be reconciled against actual tool purchase orders.
From an investment perspective, TAM expansion and market share dynamics must be decoupled. While upward WFE revisions expand the overall pie, specific process node integrations dictate market share winners. Applied Materials holds leadership positions in deposition and conductor etch, but has historically had lower exposure in dielectric etch. If 3D DRAM architectures lean heavily toward deposition and conductor etch, the company could gain market share; however, if high-volume manufacturing (HVM) schemes remain dominated by dielectric etch, realized revenue opportunities may underperform theoretical unit-capacity estimates.
Front-End Wafer Fab Equipment
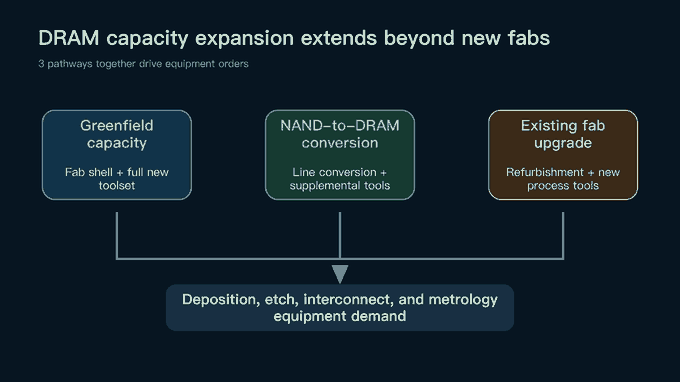
DRAM capacity expansion is currently advancing along three parallel paths: greenfield builds, NAND-to-DRAM line conversions, and brownfield fab upgrades. Investor meetings documented by JPMorgan also noted alternative debottlenecking strategies, such as retrofitting legacy packaging facilities into front-end cleanrooms and shoehorning new tools into existing fab footprints. Equipment demand is therefore not tied exclusively to new brick-and-mortar fab construction; line conversions, retrofits, and node migrations generate substantial tool orders.
As DRAM architectures migrate toward 3D, Applied Materials' competitive strengths and structural weaknesses will be magnified simultaneously. CMOS-under-Array (CuA), 4F², and 3D DRAM elevate materials processing intensity, boosting demand for epitaxial deposition, conductor etch, and adjacent steps. Historically, Applied Materials captured lower share in 3D architectures due to its limited dielectric etch footprint. Investors should look beyond headline DRAM capex and track how high-volume manufacturing process flows ultimately allocate tool spending between dielectric vs. conductor etch and deposition.
