
Contents
Executive Takeaways
Weekly Category Outlook & Fulfillment Conditions
Weekly Chronology & Catalyst Evolution
Weekly Stock Performance Across Memory Names
Weekly Performance of Key Memory Tickers
DRAM & HBM: Allocation Power, LTAs, and Customer Qualification
Quantifying Capacity Lock-in: Evaluating Customer Commitment and Downside Risk
Memory Product Lead Times vs. Balanced Market Benchmarks
Lower-Stack Debates: Challenging Per-Die Capacity Assumptions
Stacking Economics in a Dedicated Decoding System Scenario
LPDDR & SOCAMM2: AI CPUs and Rack-Level Memory Spillover
Server Demand Broadens Beyond Novel Form Factors
NAND & Enterprise SSDs: Inference, RAG, and Margin Elasticity
Decoupling Enterprise SSD Strength from Commodity NAND
Cache Tiering: Expanding SSD Workloads While Imposing Architectural Constraints
Supply Discipline Dictates the Longevity of NAND Pricing Power
HDDs: AI Data Lakes, Nearline Exabyte Shipments, and Free Cash Flow
Extended Data Retention Drives Independent HDD Demand
Demand and Constraints in Enterprise AI Storage Surveys
Tiering the Data Lake: Fast Access for Hot Data, Cost-Efficient Media for Scale
Validating the Duopoly Thesis Through Free Cash Flow
Equipment, Test, & Materials: Second-Order Beneficiaries of Memory Capex
Early Equipment Demand Visibility Does Not Equal Immediate Revenue Recognition
Advanced Packaging and Test Expansion Does Not Equal Front-End Wafer Additions
Downstream BOM Costs and Demand Destruction: Servers, Networking, Mobile, PC, and Automotive
Rising Memory Cost Share Incentivizes Downstream Optimization
Rubin VR200 NVL72 Estimated Bill of Materials (BOM) Cost Breakdown
Price Acceptance Does Not Preclude Elasticity and Volume Destruction
Investment Hierarchy, Key Risks, and Falsification Triggers
Ranking by Earnings Visibility, Calibrating by Countervailing Evidence
Research Priorities & Primary Falsification Triggers
Catalysts and Metrics to Monitor Next Week
Memory supply remains tight, but downstream customers are already recalculating their cost per inference. The focal points this week are customer order lock-in, where data is tiered across the storage hierarchy, and who ultimately absorbs price hikes. We prioritize monitoring customer delivery and commercialization in high-end DRAM, pricing and product mix in enterprise SSDs (eSSDs), and exabyte shipments and free cash flow in HDDs. De-speccing and architectural efficiency gains serve as the primary countervailing risks.
Executive Takeaways
Sellers still hold the upper hand in memory, but earnings realization is diverging across product categories. TrendForce lead-time surveys indicate persistent tightness across DRAM, enterprise SSDs, and HDDs, while KB Securities highlights lean vendor inventories and resilient order books. Concurrently, Bank of America noted that weekly DRAM and NAND pricing remained flat week-over-week. Supply tightness can persist without driving sequential weekly price acceleration.
The critical shift this week is that customers are moving beyond raw capacity expansion to dissect data architecture—specifically, determining what data requires ultra-fast access versus what can be staged further out. Debates over lower-stack HBM, Astera Labs' memory expansion offerings, and SK Hynix's tiered caching architectures all address the same core challenge: maximizing usable inference throughput within fixed capex budgets. The resulting opportunities are being reallocated across HBM, server DRAM, and enterprise SSDs.
Investment analysis must therefore balance gross demand against efficiency-driven savings. Offloading cache from HBM to DRAM expands DRAM consumption, but moving the same data block across tiers cannot be double-counted as incremental demand at every layer. When compression, sharing, and reuse boost utilization, the required capacity per workload can actually decline. Aggregate industry demand expands only if growth in workload volume, data retention, and query frequency outpaces architectural efficiency gains.
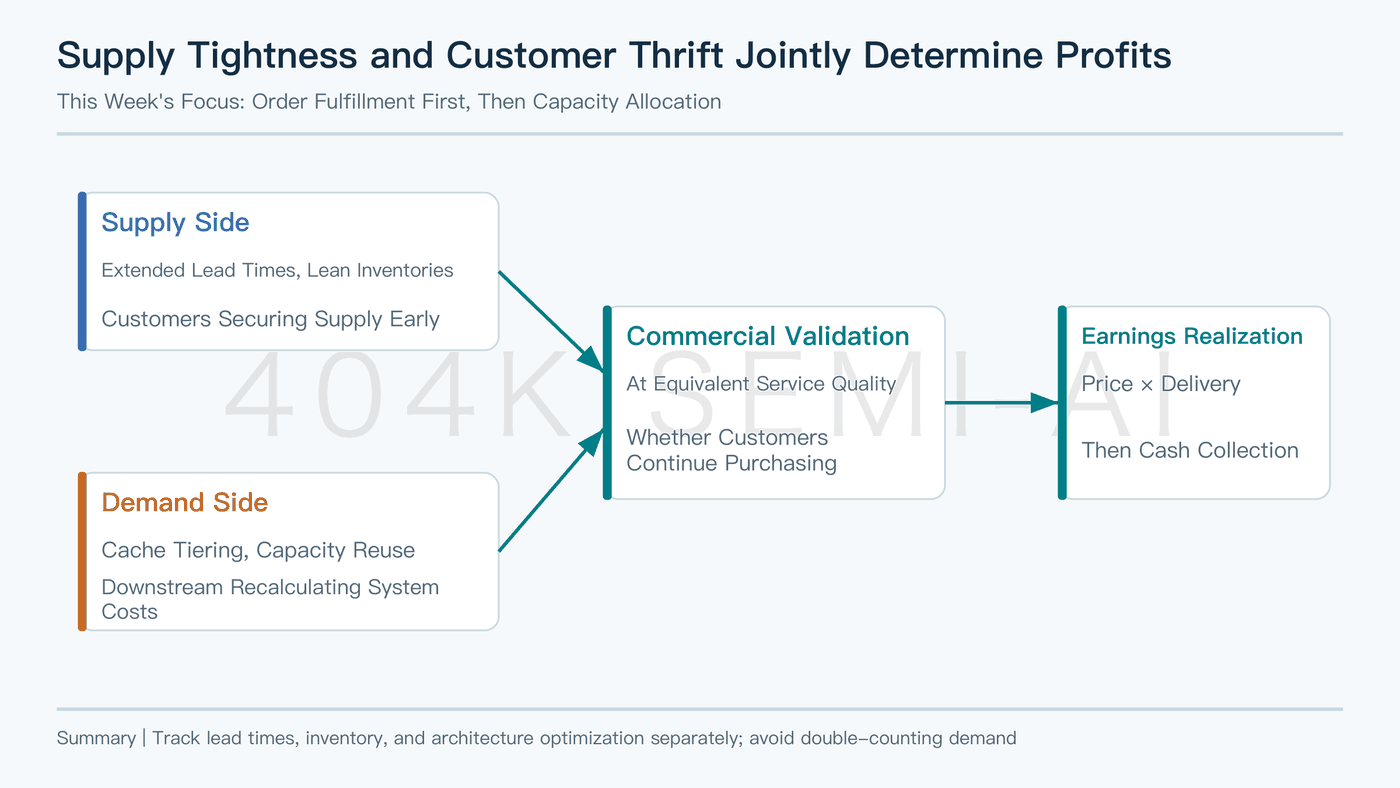
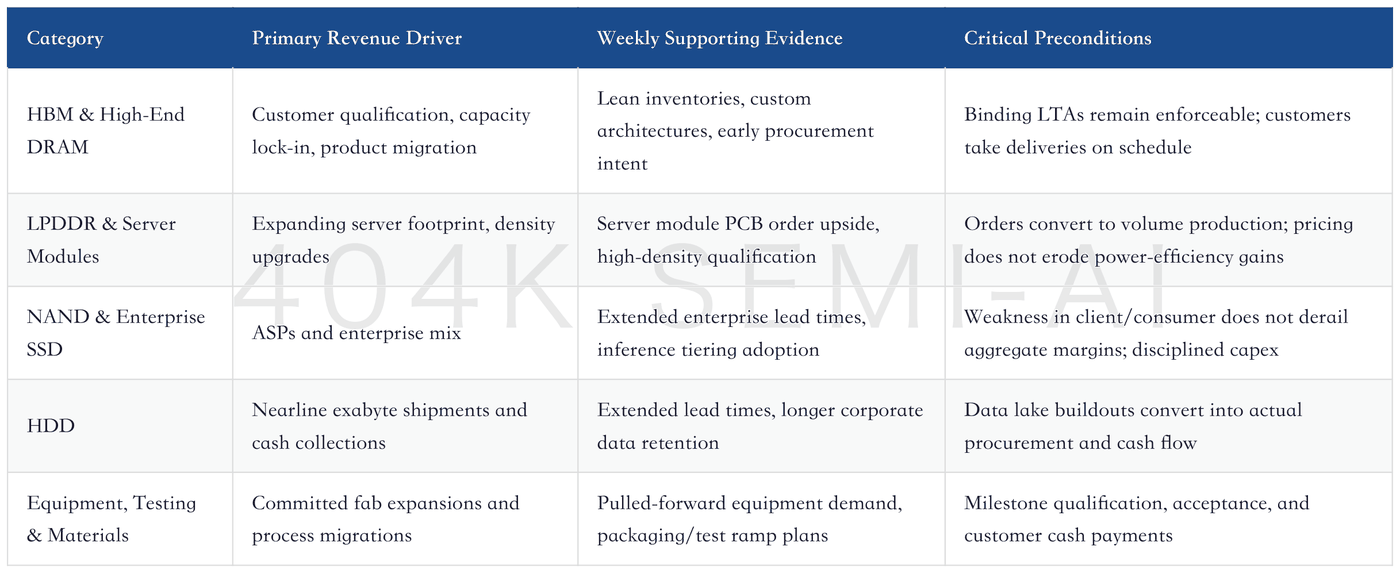
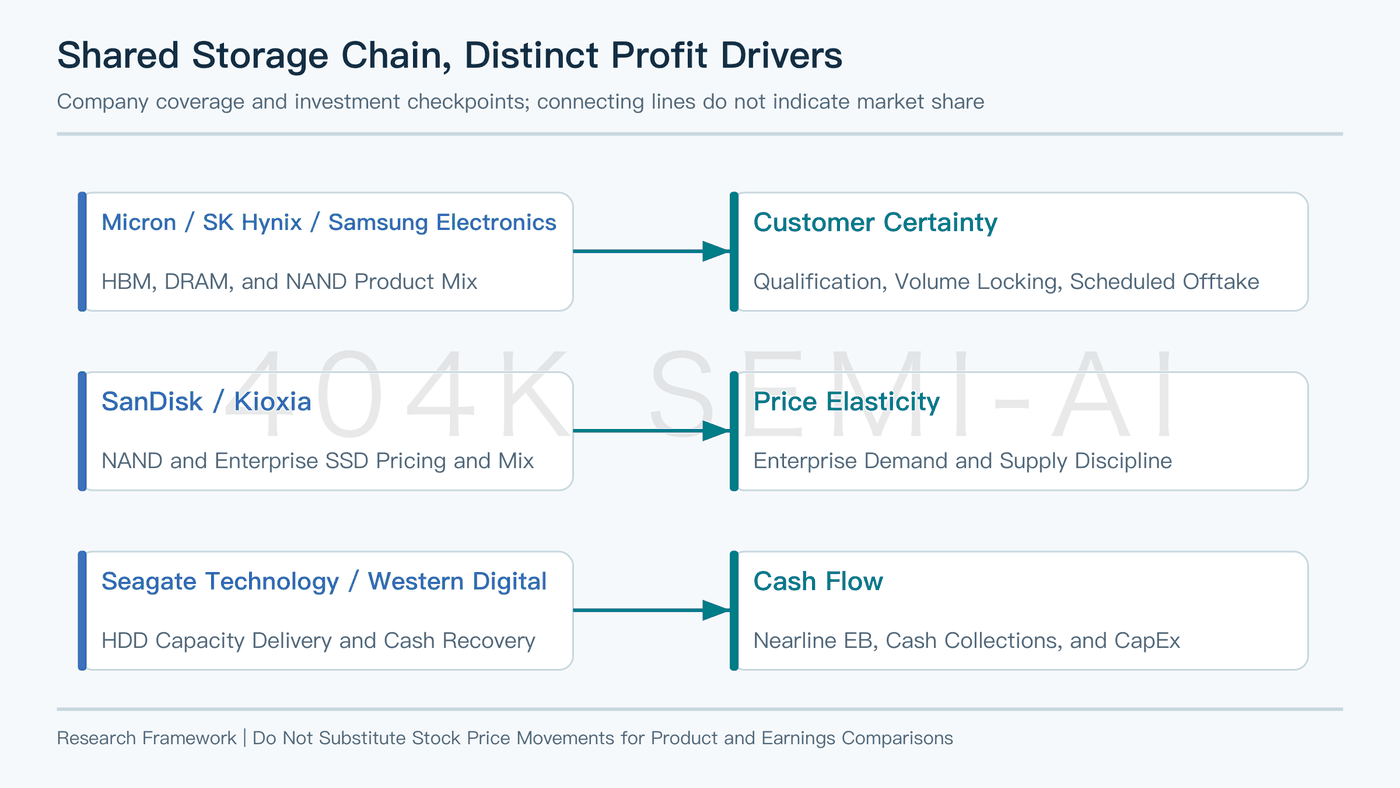
Visibility in high-end DRAM hinges on customer qualification, deliverable capacity, and binding long-term agreements (LTAs). Enterprise SSD upside depends on ASP trajectory, enterprise mix, and hyperscaler deployment pace. HDDs must convert long-term data retention needs into nearline exabyte shipments and ultimately free cash flow. While all three segments benefit from AI tailwinds, each demands a distinct valuation framework.
Current data does not justify treating long-term forward earnings as guaranteed for any vendor. Citi remains constructive on continual learning and multi-year structural shortages; BNK Investment & Securities warns that memory bill-of-materials (BOM) costs are nearing customer affordability thresholds; and TD Cowen cautions that the magnitude of positive earnings revisions for Micron may narrow. These debates over bit demand, pricing power, and margin ceilings are far more instructive than headcounts of bullish sell-side notes.
Weekly Category Outlook & Fulfillment Conditions
Weekly Chronology & Catalyst Evolution
The week opened with a debate over HBM stack configurations. Discussions on September 14 around lower-layer stack architectures shifted investor focus from per-die capacity to bandwidth-per-dollar economics. TrendForce provided counterarguments centered on base die overhead, packaging constraints, and supplier ramp incentives. Lead-time surveys published that same day confirmed that cost-reduction efforts are unfolding in an environment of tight supply, rather than signaling an outright contraction in demand.
By mid-week, debates centered on procurement dynamics and rack-level BOM budgets. Between September 15 and 16, mobile contract renegotiations, BNK's concerns over demand elasticity, reports of direct procurement by leading AI labs, and HSBC's server-rack cost modeling provided comparative data points. Upstream vendors seek earlier customer commitments, while downstream buyers aim to minimize stranded capacity. Both parties are attempting to de-risk operations, but their economic incentives are increasingly at odds.
Later in the week, the gap between technical architectures and commercial deployment became clearer. Panel sessions on September 16 emphasized that CXL cannot directly substitute for HBM's ultra-high bandwidth. On September 17, SK Hynix showcased its High Bandwidth Flash (HBF) and SALT-KV architectures, demonstrating continued progress in memory tiering. By September 18, enterprise data retention surveys and greenfield fab site evaluations refocused attention on long-term demand durability, capex discipline, and cash generation.
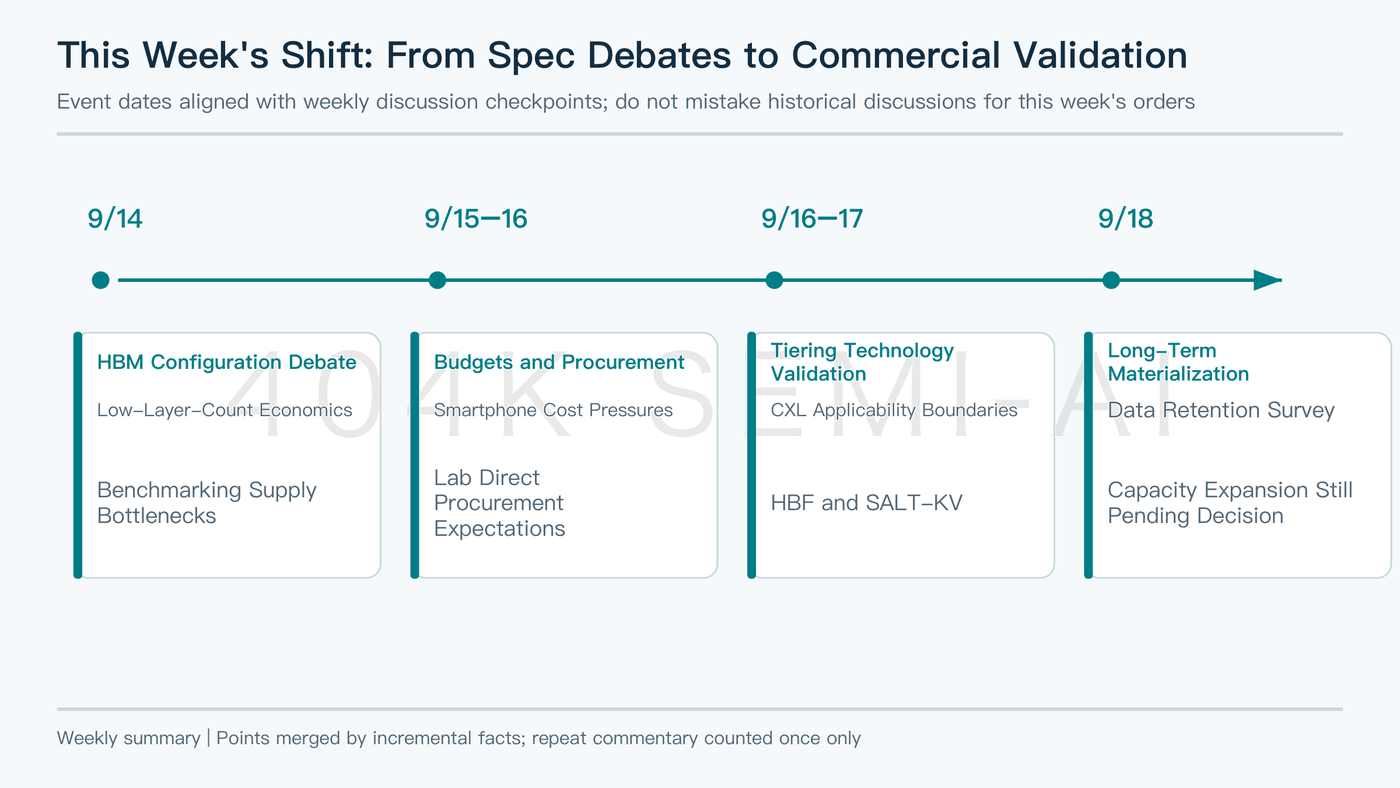
This chronological arc should not be misconstrued as an uninterrupted drumbeat of daily price increases. The overarching reality is the coexistence of supply tightness and customer-side cost optimization: procurement teams are locking in allocations ahead of time, engineering teams are optimizing capacity utilization, and finance teams are questioning whether unending price increases will truly flow through to operating margins. Over the coming week, the most critical indicators will be whether these purchasing intentions convert into binding purchase orders, volume production ramps, and physical deliveries.
Weekly Stock Performance Across Memory Names
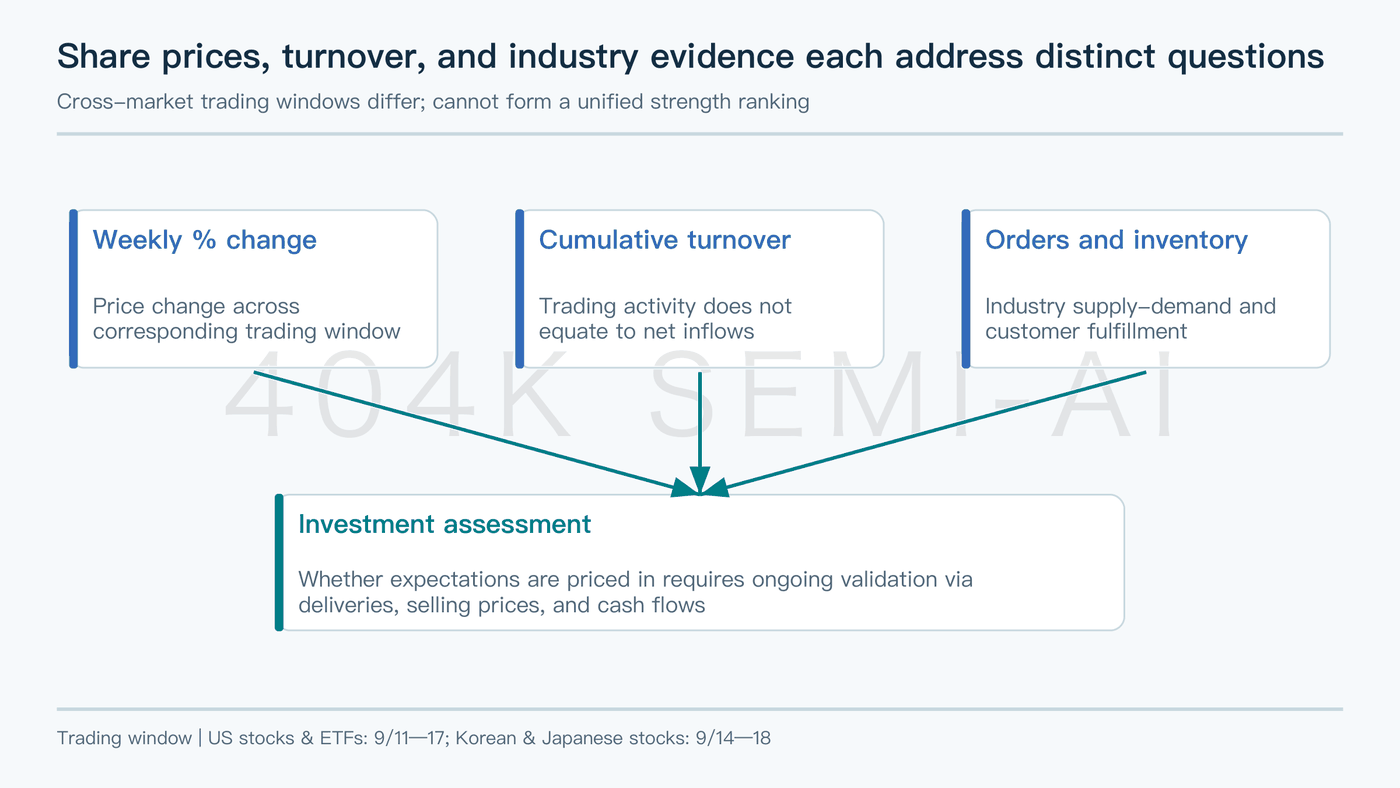
U.S. equities and ETFs are tracked from September 11 to September 17, 2026, while Korean and Japanese equities reflect the September 14 to September 18 window. Due to these non-identical trading periods, cross-market relative strength rankings should not be applied directly. While Micron demonstrated relative resilience among U.S. peers, short-term share price performance alone does not prove superior future supply allocation or margin outperformance.
Weekly Performance of Key Memory Tickers
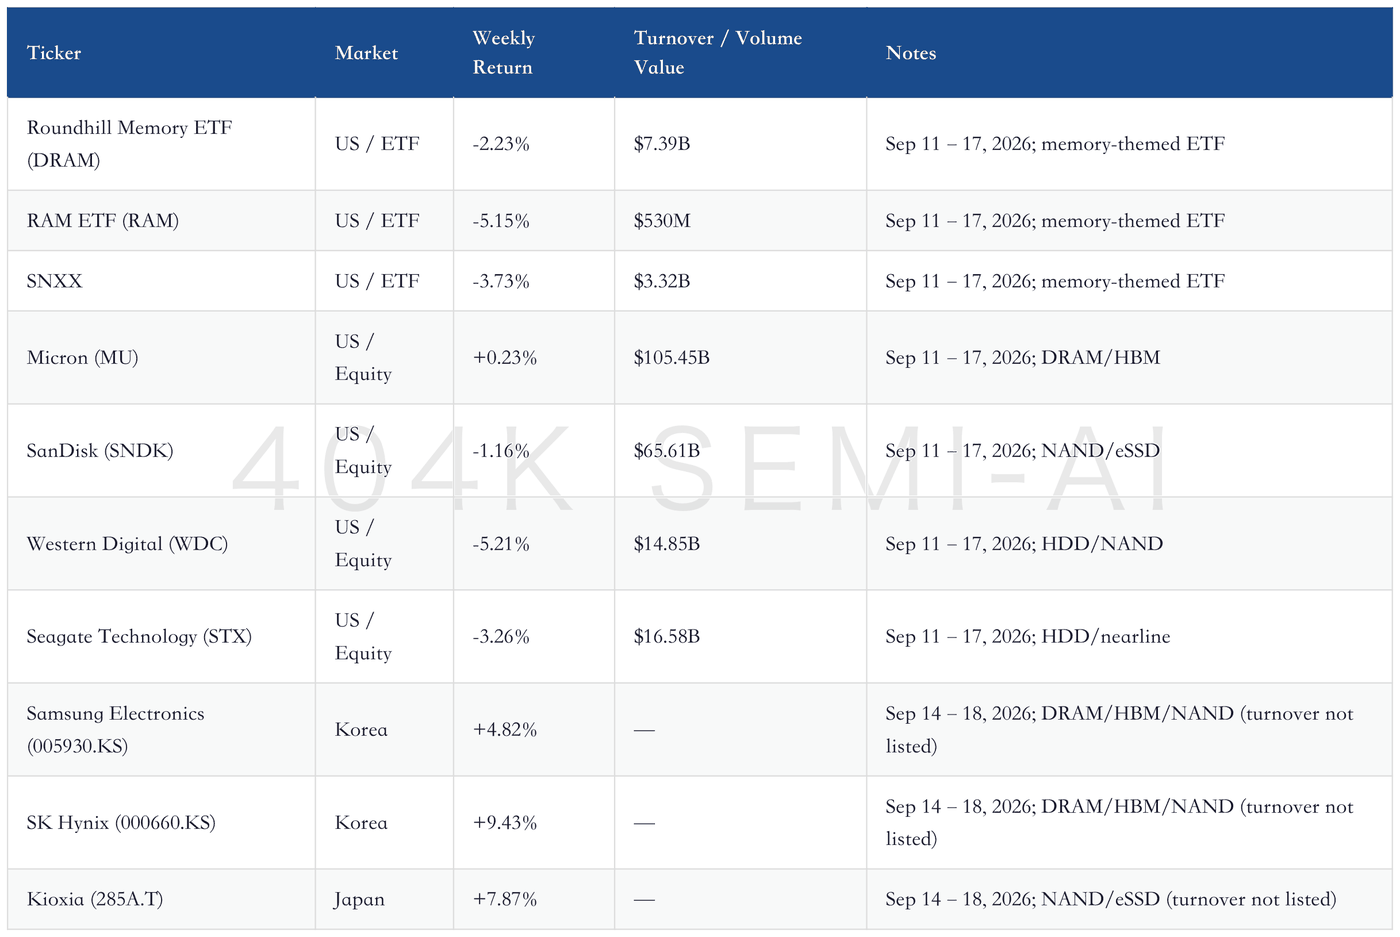
Share price movements underscore that market expectations sit squarely between underlying supply tightness and equity returns. U.S. memory ETFs broadly pulled back, whereas Korean and Japanese peers rallied within their respective trading windows. This reflects localized market dynamics rather than structural cross-border capital reallocation. Furthermore, elevated turnover does not equate to net inflows, nor does it substitute for concrete verification of bookings, pricing power, and channel inventories.
DRAM & HBM: Allocation Power, LTAs, and Customer Qualification
Quantifying Capacity Lock-in: Evaluating Customer Commitment and Downside Risk
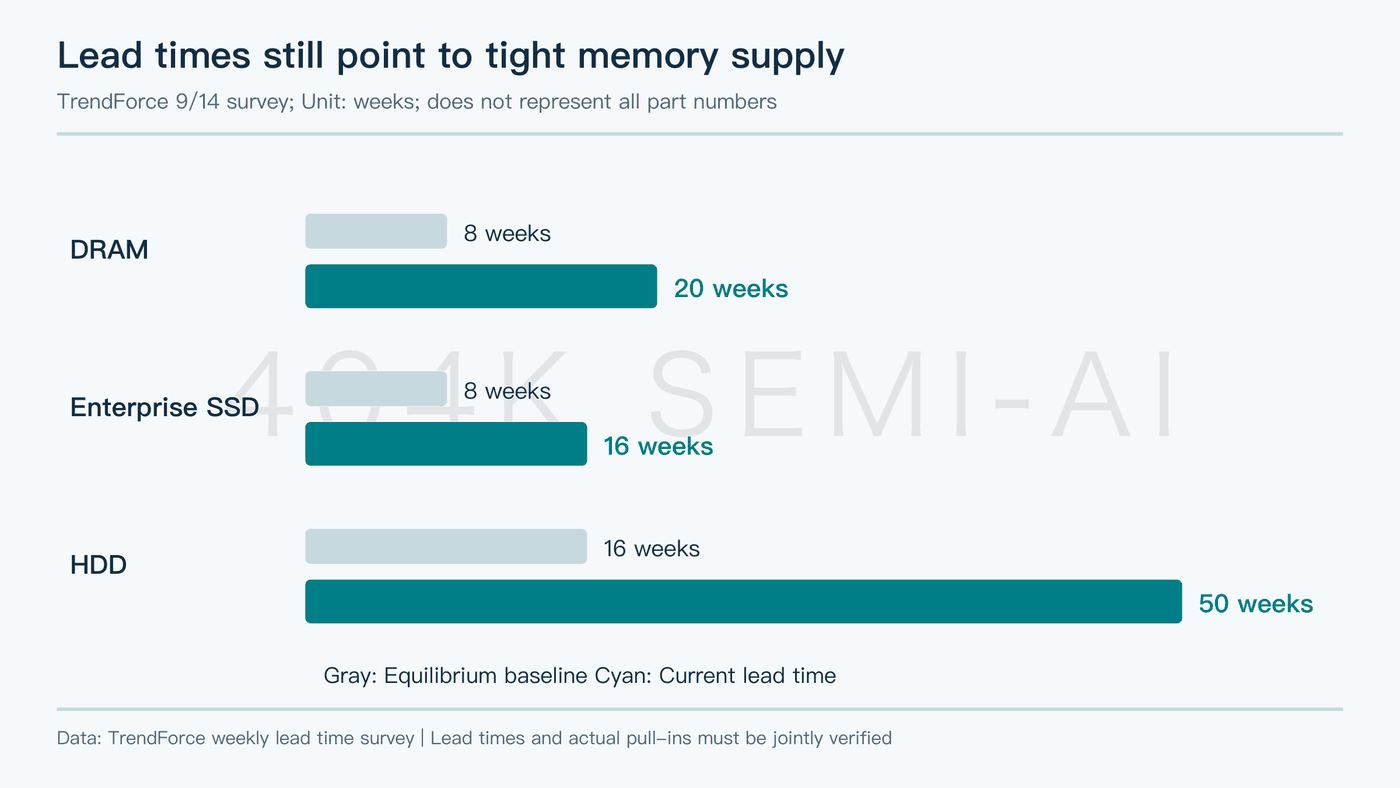
High-end DRAM remains supported by the most tangible fundamental evidence this week. TrendForce lead-time surveys and KB Securities' inventory assessments approach the market from complementary angles: fulfillment lead times on one hand, and vendor channel inventories and order pipelines on the other. Both reinforce near-term supply tightness, but neither implies uniform pricing power across every vendor, part number, or contract.
KB Securities reports that major memory chipmakers hold under 10 days of inventory, noting that customer order velocity has not decelerated through September. Days of inventory reflects inventory relative to current shipment run-rates, not that fabs will exhaust supply in 10 days. Ongoing wafer output, product mix shifts, and customer pull-in timing all influence this figure. Investors should cross-examine lean inventories against published lead times and customer delivery schedules.
Reports of customer prepayments received by Samsung Electronics offer more verifiable commercial commitment than vague claims of "sold-out capacity." In 1H26, prepayments reportedly reached approximately KRW 3.29 trillion, up 70.4% from year-end 2025. This confirms that tier-1 customers are willing to absorb capital carrying costs to secure allocation. However, the true durability of these contracts depends on specific business segment attribution, refund conditions, and price renegotiation clauses.
Memory Product Lead Times vs. Balanced Market Benchmarks

Direct procurement by frontier AI labs improves vendor visibility into end-demand, but does not expand aggregate industry bit consumption. Edgewater projects that Anthropic and OpenAI will expand direct memory procurement by 2027, with roughly 20% of Anthropic's bit demand potentially procured directly. To the extent these volumes were previously purchased through OEM server vendors or cloud partners, this shift represents a restructuring of supply chains and bargaining power, not incremental market demand.
Prepayments, advance capacity reservations, and recognized revenue must be carefully distinguished. Prepayments improve vendor working capital, but revenue recognition still depends on fulfillment. Inquiries regarding 2028 allocations demonstrate that customers prioritize long-term supply assurance, but exploratory requests for quotation (RFQs) are not non-cancellable orders. The true valuation premium of an LTA resides in minimum take-or-pay volumes, structured payment schedules, and substantial liquidated damages for breach—not the contract's headline title or multi-year duration.
Micron, SK Hynix, and Samsung Electronics must be evaluated along the same execution continuum. Micron needs to demonstrate that next-generation product migrations convert into tier-1 customer purchase orders. Having completed internal validation for HBM4, SK Hynix must now execute on customer sign-offs and sustained commercial yields. Samsung's prepayment intake and custom base die roadmap require confirmation through binding product mix allocations. Nanya Technology is best evaluated via commodity DRAM pricing and standard bit shipments, and should not be valued using HBM capacity lock-in multiples.
