
目录
Key Takeaways This Week
Cloud Revenue and AI Capital Expenditures
Data Centers, Compute Procurement, and In-House Silicon
Frontier Models, Software, and Application Monetization
M7 vs. Neocloud Divergence
Debate Points, Falsification Signals, and Next Week’s Catalysts
Cloud demand remained robust this week, with Google Cloud and Azure sustaining strong top-line momentum. However, capital deployment has expanded well beyond hardware purchases to component prepayments, power procurement, and long-term lease commitments. Sustaining current valuation multiples will depend on whether signed contracts convert into operational capacity and whether incremental inference generates sustainable margins.
Key Takeaways This Week
The core narrative across the M7 and hyperscale CSPs has transitioned from "will spending continue?" to "can capital deployed be delivered on schedule and converted into revenue?" On the demand side, there are no visible signs of a cooldown.
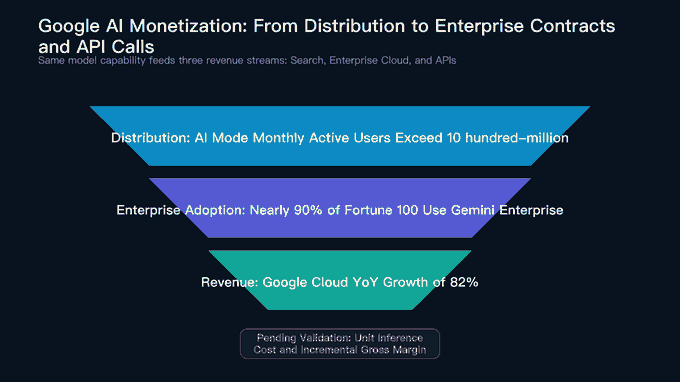
Google Cloud revenue surged 82% YoY in Q2, while its contracted backlog expanded by approximately $50 billion QoQ to roughly $514 billion.
Microsoft reported Q4 Azure revenue of $29.4 billion (+42% YoY), bringing FY2026 Azure revenue to $101.9 billion (+40% YoY). Both companies demonstrate through top-line results that enterprise cloud and AI workloads continue to migrate rapidly.
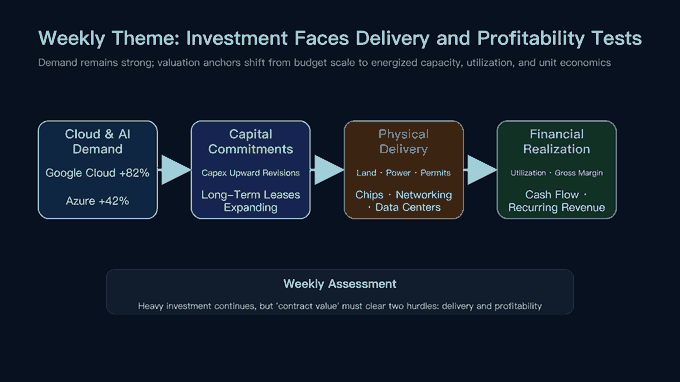
On the supply and capital side, dynamics have grown more complex. Google raised its FY2026 capex guidance from $180B–$190B to $195B–$205B and guided for substantial further increases in FY2027.
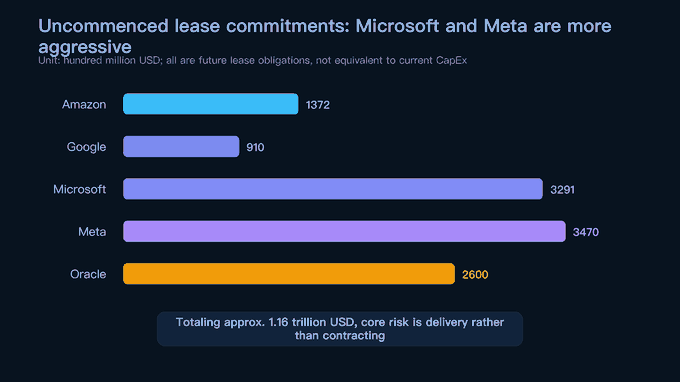
Concurrently, signed but uncommenced lease commitments across the top five CSPs totaled approximately $1.16 trillion. This figure represents forward rental liabilities rather than current capex, and should not be conflated with fully energized, operational compute.
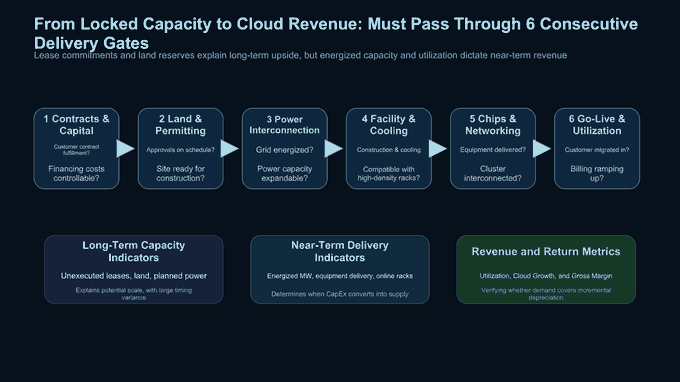
The critical analytical shift this week is the decoupling and independent reconciliation of revenue, contract commitments, and physical delivery. Cloud revenue validates underlying demand; capex, prepayments, and lease commitments reflect capital willingness; land, power, shell facilities, and supply chain capacity dictate energization timelines; while model pricing, utilization rates, and depreciation schedules determine whether revenue translates into profit. Relying on any single metric risks misjudging the underlying cycle's true momentum.
Current-week data reinforces the thesis that aggressive capital deployment continues, while fundamental realization begins to diverge.
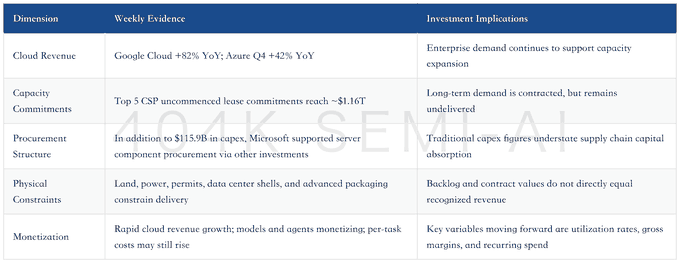
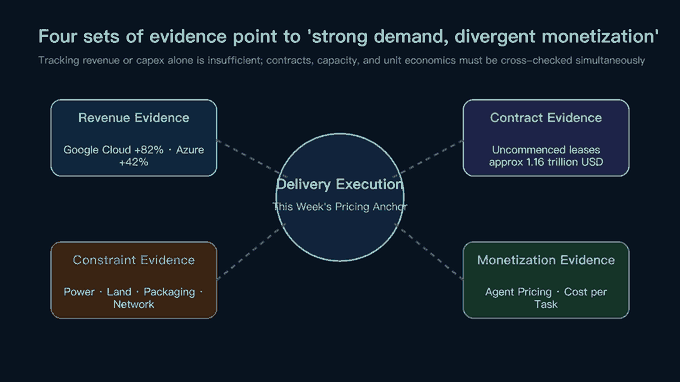
This analytical framework reorders valuation hierarchies. Hyperscalers demonstrating accelerating top-line growth alongside resilient or expanding gross margins can fund continuous expansion through operating cash flow. In contrast, players that possess contracts without delivered capacity see valuations increasingly tied to forward capacity execution and financing costs. Supply chain vendors sit in between: order visibility is rising, but revenue realization hinges on customer acceptance. Consequently, the same underlying AI demand cascades through CSP commitments, vendor component staging, hardware shipments, data center energization, and recognized cloud revenue—and must not be double-counted across these distinct phases.
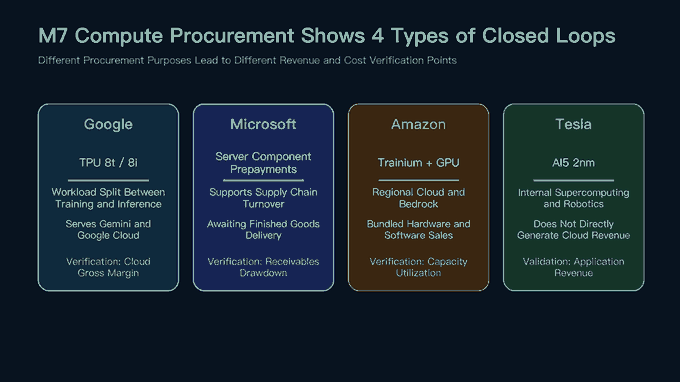
This also explains why financial trajectories across the M7 are diverging despite operating within the same AI secular expansion. Google and Microsoft validate demand via cloud revenue; Meta continues to recoup investments primarily through advertising and software products; Tesla prioritizes proprietary silicon for internal supercomputers and robotics. Meanwhile, Oracle and emerging neoclouds rely heavily on long-term lease commitments and external debt, bearing heightened delivery and refinancing risks.
Financial accounting divergences will materialize well before demand diverged. Self-built data centers drive direct capex followed by depreciation; long-term leases begin as off-balance-sheet commitments and convert into lease liabilities upon delivery; supply chain financing ties up cash and working capital up front. While all three channels secure compute capacity, they impact free cash flow, operating margins, and balance sheets differently. Assessing hyperscale capital intensity requires aggregating these three forms of cash obligations and normalizing them against operational, fully energized capacity.
Cloud Revenue and AI Capital Expenditures
Google currently demonstrates the most complete closed-loop model spanning revenue growth, backlog expansion, and capital expenditure. In Q2, Google Cloud revenue increased 82% YoY, backlog reached approximately $514 billion (+~$50 billion QoQ), and enterprise AI demand expanded cloud operating margin by roughly 1,500 bps YoY.
Nearly 90% of Fortune 100 enterprises now deploy Gemini Enterprise, with new customer additions doubling YoY, reflecting enterprise projects progressing from experimental pilots to contracted cloud revenues.
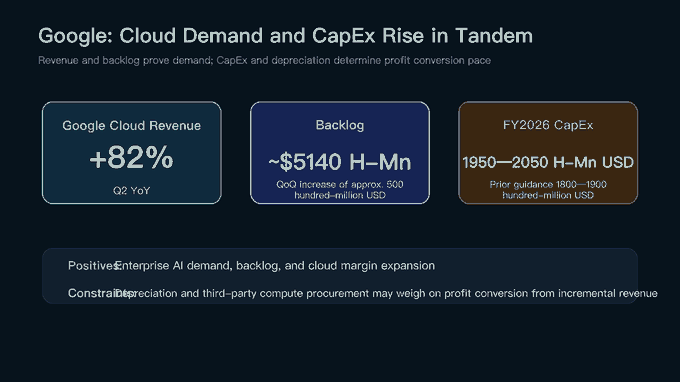
Cost pressures, however, are mounting concurrently. Google raised its FY2026 capex guidance by $15 billion to accelerate capacity deployment and meet demand. Our research model projects capex of approximately $203.1 billion in 2026 and $349.9 billion in 2027. Rising depreciation and third-party compute procurement will weigh on cloud operating margins; investors must therefore track capacity utilization and depreciation ramp rates rather than top-line growth in isolation.
While the ~$514 billion backlog offers substantial revenue visibility, it does not imply a uniform recognition timeline. Large-scale enterprise migrations require complex networking, data preparation, permissions management, and infrastructure provisioning, creating a natural lag between contract signing and billing commencement. If Google accelerates capacity delivery, capex and depreciation will hit the income statement ahead of revenue. Evaluating whether capex revisions create economic value requires cross-referencing backlog conversion rates, cloud operating margins, and capex growth within the same quarterly frame.
For Microsoft, key incremental developments center on enhanced disclosure transparency. The company reorganized its operating structure into two segments—Agents & Infrastructure and Devices & Consumers—and began breaking out standalone Azure revenue.
In Q4 FY2026, Azure revenue reached $29.4 billion (+42% YoY), bringing full-year revenue to $101.9 billion (+40% YoY).
Q1 FY2027 guidance calls for 45% YoY growth, providing the market with a clearer, more direct benchmark for cloud revenue trajectory.
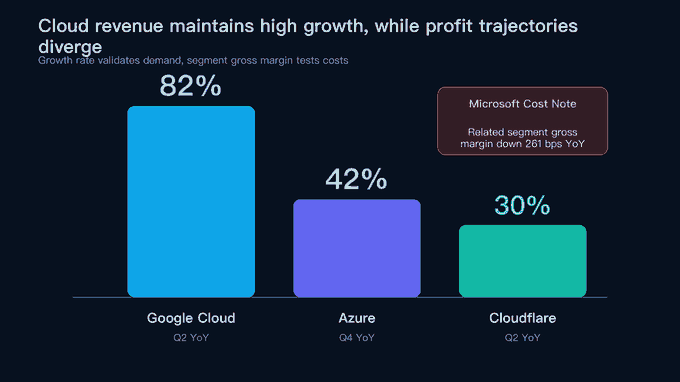
However, Microsoft's revised segmentation alters historical comparability, as GitHub Cloud and Security Copilot revenues shift from Azure to Microsoft 365 Cloud. In Q4, Agents & Infrastructure generated $74.6 billion in revenue (+23% YoY) with a gross margin of 68.5%, down 261 bps YoY. The coexistence of accelerating Azure growth and compressing segment gross margin underscores that strong top-line demand and heavy infrastructure cost pressures can coincide in the same quarter.
The true magnitude of capital commitment extends beyond headline capex. Microsoft reported FY2026 capex of $115.9 billion, while "Other investments" swung from an inflow of $2.3 billion to an outflow of $19.9 billion, explicitly attributed to facilitating server component procurement.
Other current receivables tied to server component procurement surged from $8.2 billion in June 2025 to $27.8 billion in June 2026. Microsoft is actively financing supply chain working capital, indicating cash deployment exceeds conventional capex metrics.
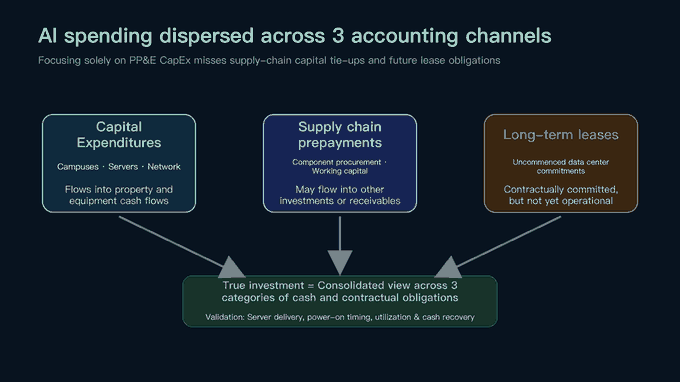
This structure pulls supply risk forward from equipment delivery to raw material and component staging. Microsoft secures component allocation and priority delivery, but at the cost of deploying cash significantly earlier off its balance sheet. If server deployments face delays, receivables and other investments will rise without an immediate contribution to cloud revenue. Evaluating Microsoft's AI investments therefore requires tracking capex, supply chain receivables, segment gross margins, and Azure revenue growth in tandem.
Capacity expansion across the top five CSPs is solidifying into a dual-track framework of self-builds and leases. Self-built operational capacity is projected to reach 40.0 GW by year-end 2026, up 43% from 28.0 GW at year-end 2025.
By 2027, self-built operational capacity is expected to reach 48.7 GW.
Leased operational capacity is projected to grow from 15.8 GW in 2025 to 20.6 GW by year-end 2026, of which 16.3 GW represents financial-disclosure-implied, non-designated leased capacity.
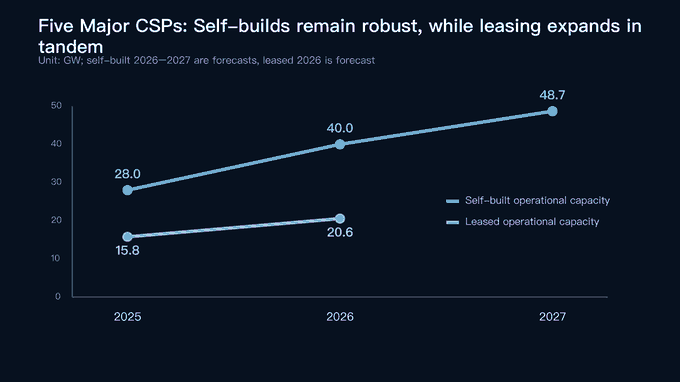
While forward lease commitments have reached massive scale, risk allocation structures across balance sheets and contracts differ markedly among operators.
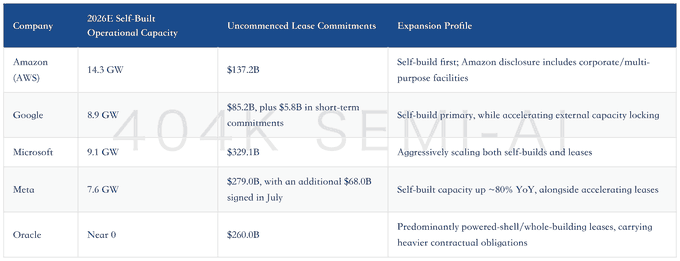
Amazon and Google lean heavily toward self-building core capacity, driven by custom silicon architectures that impose specialized data center design requirements. Microsoft and Meta pursue a hybrid strategy, aggressively scaling both self-builds and leases to trade capital for deployment speed and flexibility. Oracle outsources nearly all physical construction to third-party developers, securing entire facilities via long-term contracts. None of these models is inherently superior; the fundamental difference lies in who bears construction delays, residual asset value, financing costs, and utilization risk.
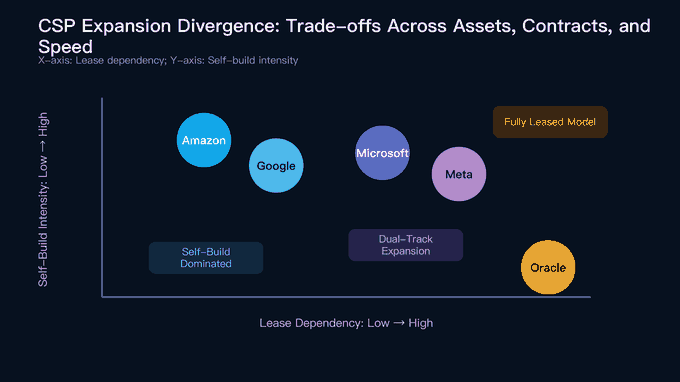
The self-build model optimizes total cost of ownership over the long run by co-designing silicon, networking, and power infrastructure to proprietary tech stacks, though it leaves idle capacity and depreciation squarely on the balance sheet if demand softens. Leasing enables faster time-to-market and offloads construction execution, but locks in rigid, long-term minimum payment obligations. The dual-track approach maximizes near-term speed at the expense of workload orchestration complexity. Moving forward, competitive assessment requires evaluating revenue generation per incremental GW, utilization rates, and contract durations, rather than ranking raw headline capacity alone.
Data Centers, Compute Procurement, and In-House Silicon
Compute procurement is shifting from simply "buying more GPUs" toward workload-tailored architecture across training, inference, and Agent workloads. With TPU 8, Google has explicitly bifurcated its training and inference technology stacks for the first time.
Training prioritizes aggregate compute and interconnect throughput, whereas inference emphasizes bandwidth, on-chip memory, and low latency.

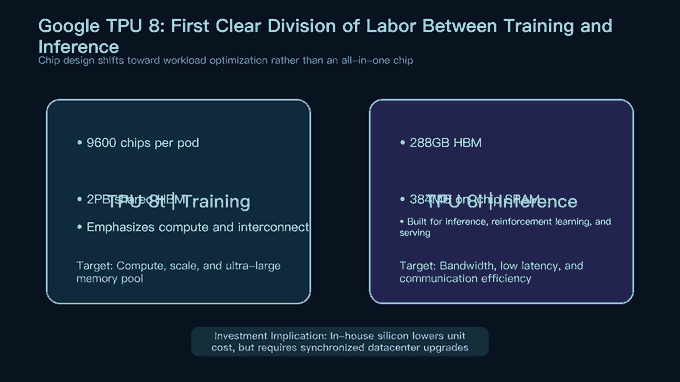
Google Cloud management noted that TPU development has accelerated from one generation every two years to two distinct platforms per year. This faster cadence has two implications: Google can lower unit inference costs while tightening the co-design of Gemini training and serving with its proprietary hardware-software stack. The trade-off, however, is that data center facilities, power, networking, and supply chains must all upgrade in lockstep with the silicon roadmap. In-house silicon reduces unit compute costs; it does not automatically lower aggregate CapEx.
By separating training from inference, Google can dedicate high-performance training clusters to frontier model iteration while deploying low-latency inference silicon for Search and enterprise Agents. While this raises the ceiling on cluster utilization, it also adds complexity across orchestration, software adaptation, and dual hardware release cycles. Whether this creates a genuine competitive edge hinges on three quantifiable milestones: a declining share of third-party compute procurement, improving per-task unit economics, and resilient cloud operating margins throughout the expansion phase.
Topline demand figures for custom silicon also warrant a more grounded interpretation. Broadcom disclosed approximately 30 GW of AI chip and networking pipeline demand, yet its combined FY2027–FY2028 revenue guidance of $345 billion implies deliverable capacity of only 12 to 17 GW.
While land, power, and data center shells dictate ultimate deliverable capacity, near-term output remains constrained by substrates, wafers, CoWoS packaging, and HBM. To alleviate bottlenecks in substrates and optical lasers, Broadcom raised its Q4 CapEx from $532 million to $1.4 billion.
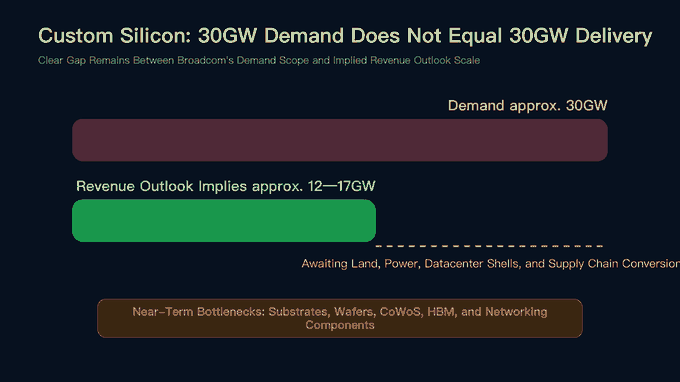
The delta between 30 GW of nominal demand and 12–17 GW of deliverable scale should not be misconstrued as order cancellations. Instead, it reflects the multi-stage friction between headline customer demand, engineering readiness, and supply-chain realities. While hyperscalers can project long-term power requirements, suppliers can only schedule shipments against confirmed wafer allocations, packaging capacity, optical components, and energized data hall availability. For investors, the key is tracking upward revisions in revenue guidance and tangible capacity expansion across substrates, lasers, and advanced packaging—rather than capitalizing the full 30 GW into forward estimates.
Microsoft's supply-chain financing arrangements further illustrate how major hyperscalers are deploying capital upstream into component procurement. By funding suppliers ahead of finished server deliveries, these outlays appear on cloud balance sheets as other investments or receivables rather than Property, Plant, and Equipment (PP&E;). For upstream vendors, this boosts order visibility; for hyperscalers, it ties up working capital and causes traditional free cash flow metrics to understate total AI capital commitments.
Tesla's AI5 exemplifies an alternative in-house silicon strategy within the M7. Research reports indicate that Samsung has confirmed it will fabricate AI5 on its 2nm process at the Taylor, Texas fab, delivering an estimated 40x boost in compute performance and a ~5x increase in memory bandwidth over HW4. Initial production runs will be allocated to Tesla's supercomputing clusters and Optimus. By leveraging custom silicon to power autonomous driving and robotics services, long-term ROI will depend on the synchronized execution of chip tape-outs, cluster deployment, and monetization from downstream applications.
AI5 represents an upfront investment in capabilities and cost structure, with revenue recognition trailing far behind. Because initial batches feed internal clusters, early production creates R&D;, tooling, and compute overhead before generating top-line returns. Silicon investments will only translate into revenue and margin expansion once measurable productivity gains emerge in autonomous driving services, robotics deployments, or factory floor efficiencies. Near-term checkpoints must follow a strict sequence: 2nm mass production yield, initial batch delivery, cluster energization, and downstream utilization—rather than extrapolating commercial revenue directly from theoretical peak compute.
Upstream CapEx is cascading into server assembly and connectivity. Research models for Luxshare Precision project that the company's data center revenue contribution will rise from 12% in 2026 to 26% by 2028.
This forecast is modeled on NVIDIA AI server rack shipment assumptions of 55,000, 105,000, and 163,000 units from 2026 to 2028, compared to 19,000 units in 2025. Growth drivers span rack-level copper cabling, connectors, server assembly, optical transceivers, liquid cooling, and power supplies. However, these figures remain projections that require corroboration across CSP procurement schedules, actual rack deliveries, and reported segment revenues.
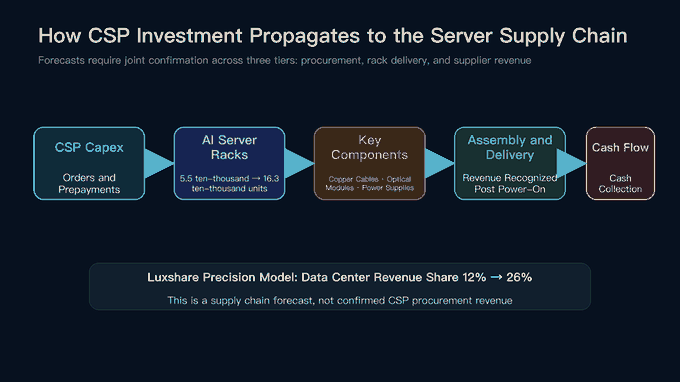
Supply chain revenue realization also depends on content value per system and customer acceptance cycles. Growth in server rack shipments does not guarantee proportional top-line expansion for connectors, liquid cooling, or power modules, as architectural shifts alter both component bill of materials (BOM) counts and pricing per rack. Luxshare's projections serve as a useful gauge of operating leverage, not as firm backlog. Going forward, investors should cross-check rack delivery milestones, data center revenue share, and gross margins to discern whether growth is volume-driven, ASP-led, or a product mix effect.
Frontier Models, Software, and Application Monetization
Google is deploying its model capabilities across three distinct monetization vectors. The first is Google Cloud and Gemini Enterprise, monetized via enterprise contracts and consumption-based usage. The second is Search, where AI Mode now exceeds 1 billion monthly active users (MAUs) and helped drive a 16.8% YoY increase in Q2 Search & other revenue. The third is developer API access, where rapid release cycles and aggressive pricing drive query volumes. With enterprise penetration, user adoption, and cloud revenue already scaling, the next critical test will be verifying unit inference cost trajectories and incremental gross margins.
Gemini 3.8 Flash illustrates why investors must decouple "price per token" from "cost per task." Marking the fourth Flash release in under four months, the model underscores a relentless release cadence.
Through year-end, pricing is set at $0.75 per 1M input tokens and $3.75 per 1M output tokens. However, benchmark evaluations show a blended cost per task of $0.58, approximately 40% higher than its predecessor.
This cost increase stems primarily from a 30% rise in average output tokens per run and more multi-turn Agent reasoning loops. Even when headline per-token rates remain flat, the total bill required to complete a complex task can still rise.
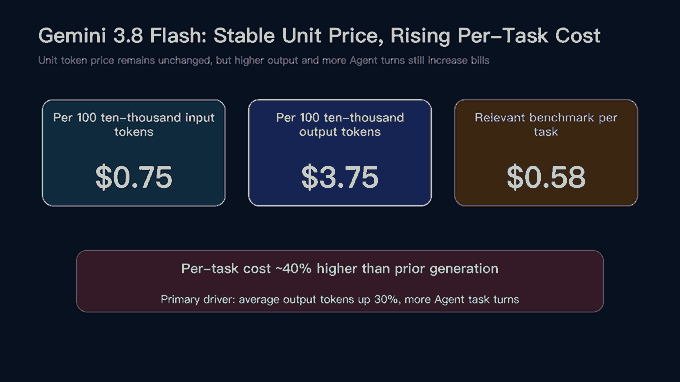
This dynamic proves that model monetization cannot be evaluated on list prices alone. More capable Agentic systems generate more tokens, invoke more tools, and consume longer inference runtimes. For cloud providers, longer-running tasks boost gross consumption and cluster utilization, but also inflate serving costs and customer subsidies. A sustainable business model requires revenue per task to outpace the growth in underlying inference compute costs while sustaining high task-completion retention and repeat usage.
Microsoft and Amazon are productizing multi-cloud interconnectivity. AWS and Azure introduced a preview of direct private cross-cloud networking across four initial regions—US East, US West, Sydney, and Frankfurt—cutting provisioning latency from weeks to minutes. Multi-cloud interconnect lowers migration friction and configuration overhead for enterprise clients, while expanding provider revenue touchpoints into peering fees, data transfer egress, and complementary network services.
Enhanced interconnectivity makes it frictionless for enterprises to distribute training, inference, and data lakes across competing clouds rather than committing to a single monolithic stack. While AWS and Azure capture incremental cross-cloud bandwidth and networking revenue, they also risk lowering workload switching costs. Future monitoring should track general availability region rollouts, enterprise adoption curves, and data transfer pricing to determine whether this represents net-new network monetization or a concession on single-cloud lock-in.
Meta introduced a monthly subscription tier for Muse Code alongside a developer preview SDK. The tool orchestrates complex software engineering workflows across multiple Agents while maintaining persistent context across sessions. While this establishes a defined monetization interface, the absence of disclosed subscription pricing, paying seat counts, and underlying inference costs means it should be viewed as an early commercial pilot rather than a predictable driver of near-term revenue.
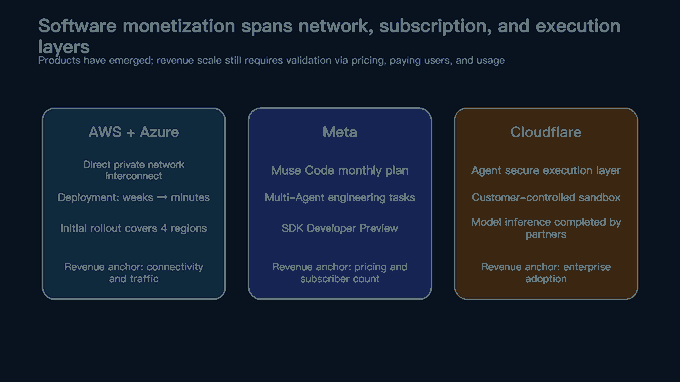
Cloudflare is positioning itself at the Agent execution layer. The company enables cloud-based coding Agents to execute in customer-controlled sandboxes: third-party partners handle model inference, planning, and orchestration, while tool invocation and code execution occur inside Cloudflare's isolated runtime. Its core offering is secure runtime execution and edge infrastructure, leaving foundation models to partners. Cloudflare reported Q2 revenue of $665 million (+30% YoY) and an adjusted operating margin of 14%. However, research reports caution that inference and execution workloads could ultimately be absorbed by hyperscalers or alternative compute layers—representing the primary structural headwind to this thesis.
Amazon's regional expansion bundles infrastructure buildout, proprietary silicon, and foundation model distribution into an integrated go-to-market package. AWS plans to launch its first Saudi cloud region in December 2026 as part of a $5.3 billion infrastructure commitment. In partnership with local entities, the project targets up to 50 MW of capacity by 2028, deploying both Trainium and NVIDIA clusters while distributing localized models via Amazon Bedrock. Realizing returns on regional cloud investments will depend on enterprise migration velocity, capacity utilization rates, and API call volumes—not headline CapEx figures alone.
M7 vs. Neocloud Divergence
The Magnificent Seven (M7) retain the decisive structural advantage of controlling their own cash flows, customer relationships, and product distribution. Google connects TPU, Gemini, Search, and Google Cloud; Microsoft captures enterprise demand across Azure, Microsoft 365, and Copilot; Amazon combines infrastructure and model services through AWS, Trainium, and Bedrock; and Meta leverages advertising cash flow to fund foundational models and AI agents. Tesla treats custom silicon primarily as an internal productivity engine, resulting in a longer timeline for direct revenue validation.
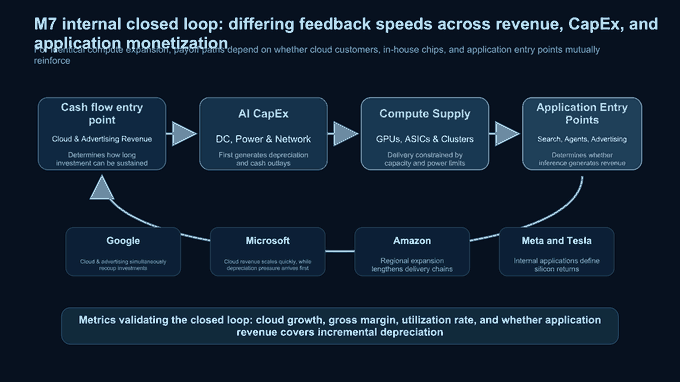
Capital payback cycles vary significantly across these closed loops. Google and Microsoft recognize revenue relatively quickly based on cloud compute consumption; Amazon must await regional capacity buildouts and enterprise workload migrations; Meta recoups capex via advertising efficiency gains and software subscriptions; and Tesla depends on downstream service monetization. Assessing ROI on capex requires aligning with each company's distinct monetization pathway. Applying a uniform short-term revenue multiple across all M7 players underestimates the time lag of internal applications while overlooking the faster billing velocity of hyperscale cloud businesses.
Neocloud growth relies far more heavily on long-term contracts and project financing. Anthropic reportedly signed a $35 billion cloud computing agreement with Lambda, backed by Hut 8's 700 MW campus development in Texas under a 15-year lease. NVIDIA supplies GPUs while participating in financing through equity investments and lease commitments. End customers, silicon, land, and capital are tied into a single contractual chain, offering high order visibility but also compounding revenue delay risks if any single node slips.
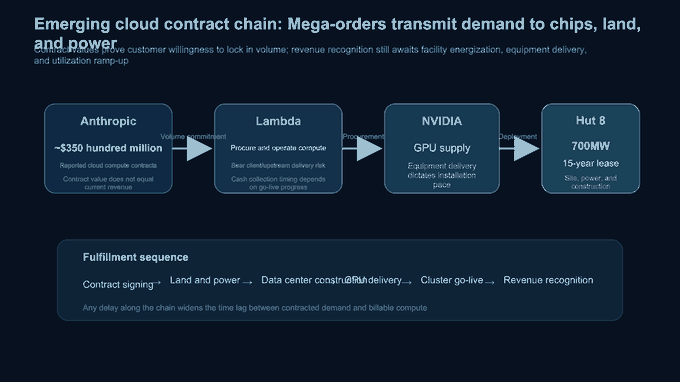
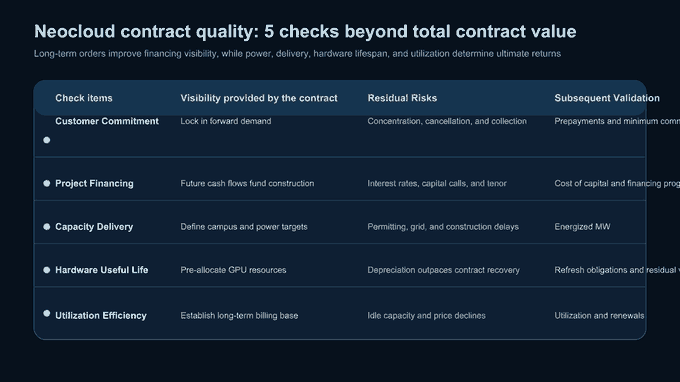
The demand base is also broadening. Quantitative trading firm Jane Street reportedly signed a 5-year, ~$13 billion cloud services contract with Crusoe, expanding compute workloads beyond AI labs to proprietary algorithms, market simulations, data analytics, and risk management. While long-term contracts facilitate neocloud debt financing, investors must scrutinize minimum volume commitments (take-or-pay), termination clauses, power cost pass-throughs, GPU refresh costs, depreciation schedules, and customer concentration risks.
These contracts effectively transform future cash flows into financing collateral, enabling developers to build out power and shell capacity in advance. However, structural risks are magnified: contract durations often exceed the economic life of GPUs, while customer requirements and hardware generations can shift well before leases expire. If compute pricing declines faster than asset depreciation, neoclouds must compensate with higher utilization. Contract quality should be assessed by upfront cash deposits, minimum volume commitments, renewal terms, and hardware refresh liabilities, rather than headline total contract value (TCV) alone.
A substantial gap remains between project approvals and commercial energization. For example, while Nebius has secured zoning approvals and executed power contracts for a 1.2 GW campus, capacity will be energized in phased tranches.

Another publicly announced 8 GW campus still faces land acquisition, environmental remediation, and permitting hurdles. For neoclouds, announced gigawatts represent pipeline targets, whereas energized megawatts and contracted utilization represent actual revenue-generating assets.
Milestone-based disclosures are far more informative than headline master plans. Zoning, power purchase agreements (PPAs), civil construction, MEP/equipment installation, and grid energization each derisk a distinct phase, but only the final two stages allow capacity to generate billing. Investors should categorize each campus across four tiers—Permitted, Under Construction, Energized, and Contracted—and track them against execution schedules. If announcements merely swell long-dated GW totals while near-term energized MW stalls, capital requirements will escalate while revenue realization slips further into the future.
Debate Points, Falsification Signals, and Next Week’s Catalysts
The first debate is whether cloud revenue growth can continue outrunning rising cost structures. While strong growth at Google Cloud and Azure validates resilient demand, Google continues to revise capex upward, and Microsoft's "Agents and Infrastructure" gross margin declined year-over-year. If revenue growth decelerates while depreciation, third-party compute, power, and financing costs escalate, margin compression will precede top-line weakness. Key checkpoints for next week include Azure growth guidance delivery, Google Cloud operating margins, and per-task model inference costs.
Free cash flow provides the most rigorous reality check. Capex, supply-chain prepayments, and lease payments require immediate cash outflows, whereas cloud revenue is recognized over time. Expanding revenue paired with deteriorating FCF indicates an elongating payback period; only a simultaneous improvement across revenue, margins, and FCF confirms that newly deployed capacity is being productively monetized. For the M7, free cash flow is not a proxy for demand, but it remains the ultimate constraint on the quality of balance-sheet expansion.
The second debate centers on whether contracted pipelines can successfully convert into operational capacity. Approximately $1.16 trillion in uncommenced lease commitments provides substantial long-term visibility, yet remains constrained by grid interconnects, local permitting, and developer execution. Neoclouds face the added hurdles of customer concentration and elevated financing costs. A more direct falsification signal is the emergence of tradable idle capacity in older GPU generations; while isolated cases do not prove structural industry overcapacity, they underscore the need to track actual utilization and contract renewals rather than headline TCV.
Uncommenced leases also involve reporting mismatches. They reflect future contractual payment obligations but reveal neither precise delivery schedules nor the marketable compute capacity they represent, meaning they cannot be simply summed with current capex. A more rigorous approach is to decompose lease commitments by expected commencement year and benchmark them against developer energization schedules and customer utilization. If lease commitments continue to outpace operational capacity additions, long-term visibility improves, but near-term cash-flow drag increases in tandem.
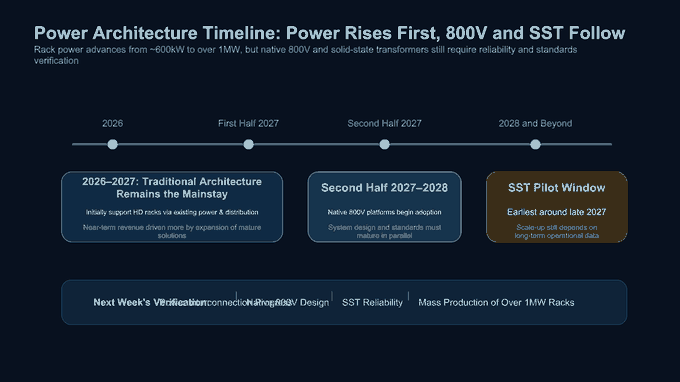
The third debate concerns the timing of power architecture upgrades. As rack power densities advance toward 600 kW and ultimately surpass 1 MW, legacy 48V/54V architectures face physical bottlenecks in current carrying capacity, thermal dissipation, footprint, and copper weight. While 800V DC reduces power conversion stages, it demands redesigned circuit protection, reliability safeguards, and safety architectures.
On timing, legacy architectures will remain dominant through 2026–2027, with native 800V racks expected to enter volume deployment between 2H27 and 2028.
Solid-state transformers (SSTs) represent a longer-term transition. Legacy power distribution chains—spanning medium-voltage transformers, UPS, power distribution units (PDUs), and server power supplies—typically operate below 90% end-to-end efficiency. While SSTs promise higher system efficiency and smaller footprints, mass commercial deployment is unlikely before late 2027 or early 2028. Standards remain fragmented, multi-year operating reliability data is lacking, and incumbent 800V HVDC solutions adequately address near-term requirements. Vendor revenues should be valued progressively across pilot trials, certifications, design wins, and volume production, rather than pricing in immediate wholesale replacement.
Power architecture transitions will also reshape CSP procurement cycles. Near-term capacity expansion continues to rely on mature transformers, UPS systems, and server power supplies, while provisioning physical interfaces and space for future 800V racks. If SST certification is delayed, the lifecycle for traditional power gear will extend; conversely, if native 800V adoption accelerates, content value across copper, distribution tiers, and power electronics will be reallocated. Next week, investors should distinguish between "rising rack power density" (an ongoing reality) and "mass production of new power architectures" (which still requires firm POs and field telemetry data).
To evaluate structural strength heading into next week, focus on five verifiable metric sets:
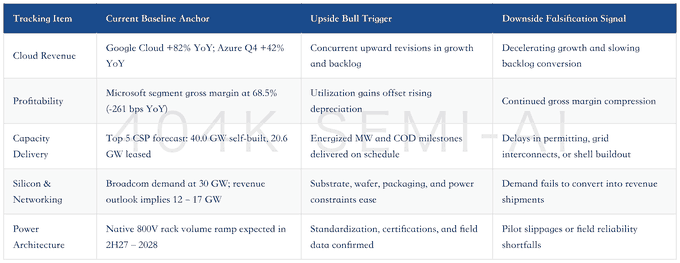
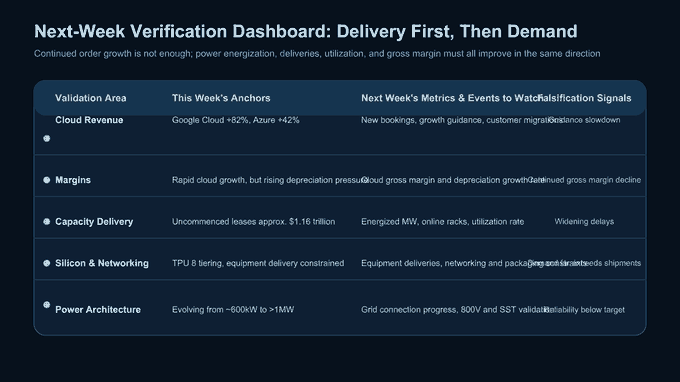
We maintain a constructive fundamental view on cloud and AI infrastructure demand this week, but urge investors to reduce reliance on the assumption that "announced capex equals realized revenue." While Google and Microsoft have already validated demand through cloud top-line delivery, Amazon, Meta, and Oracle must still prove that contracted capacity can be energized on schedule. Over the next phase, focus must center on energized operational capacity, utilization rates, cloud gross margins, unit cost per inference task, and free cash flow.